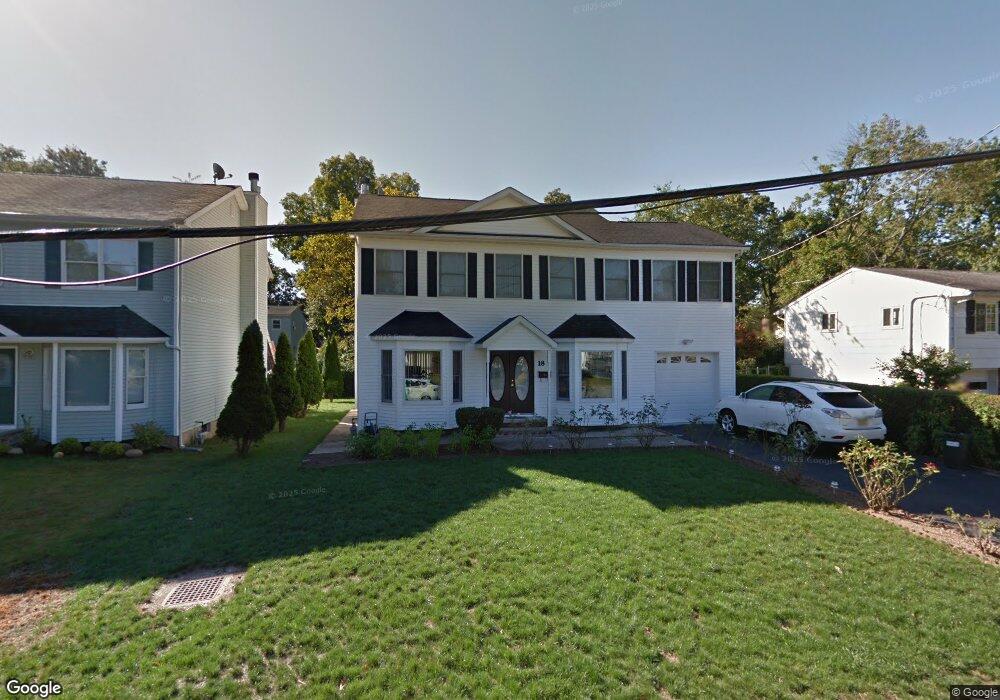
18 Orston Rd Parsippany, NJ 07054
Estimated Value: $702,153 - $863,000
--
Bed
--
Bath
2,414
Sq Ft
$331/Sq Ft
Est. Value
About This Home
This home is located at 18 Orston Rd, Parsippany, NJ 07054 and is currently estimated at $799,288, approximately $331 per square foot. 18 Orston Rd is a home located in Morris County with nearby schools including Lake Parsippany Elementary School, Brooklawn Middle School, and Parsippany Hills High School.
Ownership History
Date
Name
Owned For
Owner Type
Purchase Details
Closed on
Dec 1, 2011
Sold by
Patel Dineshchandra S and Patel Gitaben D
Bought by
Patel Dinesh S and Patel Gitaben D
Current Estimated Value
Purchase Details
Closed on
Aug 19, 2002
Sold by
William C Taylor Jr Company
Bought by
Patel Dineshchandra and Patel Gitaben
Home Financials for this Owner
Home Financials are based on the most recent Mortgage that was taken out on this home.
Original Mortgage
$285,000
Outstanding Balance
$120,770
Interest Rate
6.57%
Estimated Equity
$678,518
Purchase Details
Closed on
Jan 27, 2001
Sold by
Magarelli Samuel and Magarelli Saverio
Bought by
William C Taylor Jr Company Llc
Home Financials for this Owner
Home Financials are based on the most recent Mortgage that was taken out on this home.
Original Mortgage
$510,000
Interest Rate
7.01%
Mortgage Type
Construction
Create a Home Valuation Report for This Property
The Home Valuation Report is an in-depth analysis detailing your home's value as well as a comparison with similar homes in the area
Home Values in the Area
Average Home Value in this Area
Purchase History
| Date | Buyer | Sale Price | Title Company |
|---|---|---|---|
| Patel Dinesh S | -- | None Available | |
| Patel Dineshchandra | $395,000 | -- | |
| William C Taylor Jr Company Llc | $280,000 | -- |
Source: Public Records
Mortgage History
| Date | Status | Borrower | Loan Amount |
|---|---|---|---|
| Open | Patel Dineshchandra | $285,000 | |
| Previous Owner | William C Taylor Jr Company Llc | $510,000 |
Source: Public Records
Tax History Compared to Growth
Tax History
| Year | Tax Paid | Tax Assessment Tax Assessment Total Assessment is a certain percentage of the fair market value that is determined by local assessors to be the total taxable value of land and additions on the property. | Land | Improvement |
|---|---|---|---|---|
| 2025 | $13,170 | $380,300 | $134,500 | $245,800 |
| 2024 | $12,919 | $380,300 | $134,500 | $245,800 |
| 2023 | $12,919 | $380,300 | $134,500 | $245,800 |
| 2022 | $12,052 | $380,300 | $134,500 | $245,800 |
| 2021 | $12,052 | $380,300 | $134,500 | $245,800 |
| 2020 | $11,766 | $380,300 | $134,500 | $245,800 |
| 2019 | $11,451 | $380,300 | $134,500 | $245,800 |
| 2018 | $11,200 | $380,300 | $134,500 | $245,800 |
| 2017 | $10,949 | $380,300 | $134,500 | $245,800 |
| 2016 | $10,759 | $380,300 | $134,500 | $245,800 |
| 2015 | $10,473 | $380,300 | $134,500 | $245,800 |
| 2014 | $10,337 | $380,300 | $134,500 | $245,800 |
Source: Public Records
Map
Nearby Homes
- 206 Atlantic Dr
- 59 Kingston Rd
- 32 Hardwick Ct
- 115 Northfield Rd
- 417 Allentown Rd
- 260 Everett Rd
- 14 Braemar Ct
- 10 Buena Rd
- 1035 Littleton Rd
- 21 Dolly Dr
- 91 Farmingdale Dr
- 14 Willow Ln
- Rockefeller with Library Plan at Parq
- Rockefeller Plan at Parq
- 51 Willow Ln
- 44 Willow Ln
- 49 Willow Ln
- 3 Queen St
- 189 Littleton Rd Unit 41
- 9 Craydon St