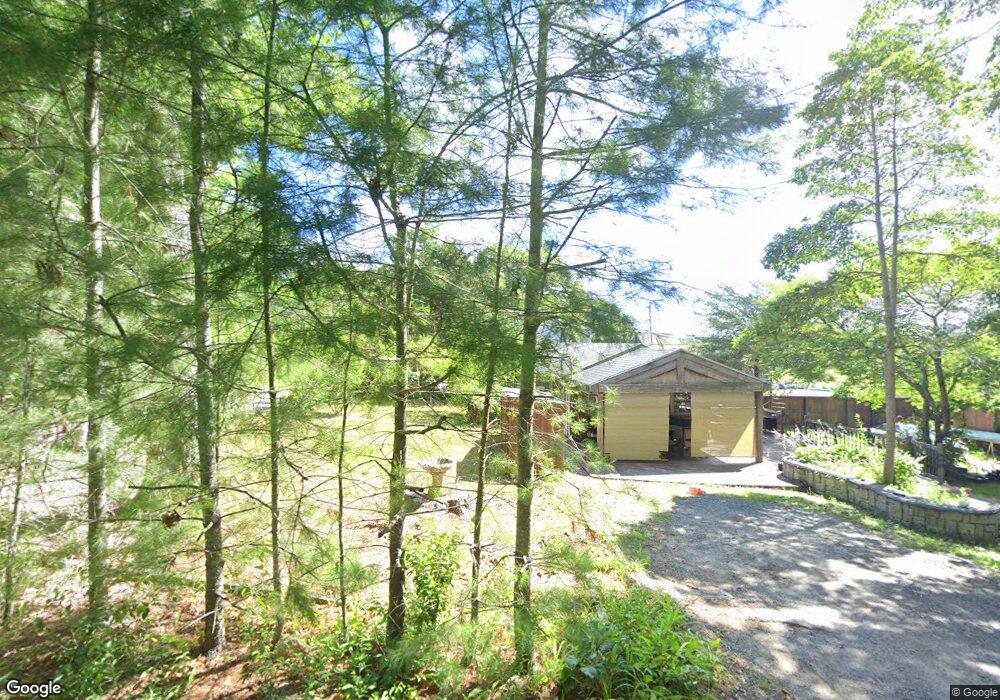
18 Osborne Ave West Wareham, MA 02576
Estimated Value: $347,247 - $380,000
2
Beds
1
Bath
656
Sq Ft
$561/Sq Ft
Est. Value
About This Home
This home is located at 18 Osborne Ave, West Wareham, MA 02576 and is currently estimated at $367,812, approximately $560 per square foot. 18 Osborne Ave is a home located in Plymouth County.
Ownership History
Date
Name
Owned For
Owner Type
Purchase Details
Closed on
Oct 27, 2015
Sold by
Reekie Angelica
Bought by
Pelletier Matthew D
Current Estimated Value
Home Financials for this Owner
Home Financials are based on the most recent Mortgage that was taken out on this home.
Original Mortgage
$130,591
Outstanding Balance
$103,471
Interest Rate
4.25%
Mortgage Type
FHA
Estimated Equity
$264,341
Purchase Details
Closed on
Jul 21, 2011
Sold by
Bohn John J
Bought by
Reekie Angelica
Home Financials for this Owner
Home Financials are based on the most recent Mortgage that was taken out on this home.
Original Mortgage
$118,907
Interest Rate
4.87%
Mortgage Type
FHA
Create a Home Valuation Report for This Property
The Home Valuation Report is an in-depth analysis detailing your home's value as well as a comparison with similar homes in the area
Home Values in the Area
Average Home Value in this Area
Purchase History
| Date | Buyer | Sale Price | Title Company |
|---|---|---|---|
| Pelletier Matthew D | $133,000 | -- | |
| Pelletier Matthew D | $133,000 | -- | |
| Reekie Angelica | $122,000 | -- | |
| Reekie Angelica | $122,000 | -- |
Source: Public Records
Mortgage History
| Date | Status | Borrower | Loan Amount |
|---|---|---|---|
| Open | Pelletier Matthew D | $130,591 | |
| Closed | Pelletier Matthew D | $130,591 | |
| Previous Owner | Reekie Angelica | $118,907 | |
| Previous Owner | Reekie Angelica | $70,000 | |
| Previous Owner | Reekie Angelica | $155,000 |
Source: Public Records
Tax History Compared to Growth
Tax History
| Year | Tax Paid | Tax Assessment Tax Assessment Total Assessment is a certain percentage of the fair market value that is determined by local assessors to be the total taxable value of land and additions on the property. | Land | Improvement |
|---|---|---|---|---|
| 2025 | $2,838 | $272,400 | $95,400 | $177,000 |
| 2024 | $2,884 | $256,800 | $72,100 | $184,700 |
| 2023 | $2,461 | $225,000 | $62,300 | $162,700 |
| 2022 | $2,461 | $186,700 | $62,300 | $124,400 |
| 2021 | $2,280 | $169,500 | $62,300 | $107,200 |
| 2020 | $2,160 | $162,900 | $62,300 | $100,600 |
| 2019 | $2,005 | $150,900 | $56,000 | $94,900 |
| 2018 | $1,922 | $141,000 | $56,000 | $85,000 |
| 2017 | $1,779 | $132,300 | $56,000 | $76,300 |
| 2016 | $1,610 | $119,000 | $53,200 | $65,800 |
| 2015 | $1,555 | $119,000 | $53,200 | $65,800 |
| 2014 | $1,546 | $120,300 | $49,800 | $70,500 |
Source: Public Records
Map
Nearby Homes
- 12 Taft St
- 26 Washington Dr
- 21 Windsor Dr
- 929 Point Rd
- 0 Cromesett Rd (Off) Unit 73385395
- 5 Sola's Cir
- 6 A Rock Marsh Rd Unit A
- 6 A Rock Marsh Rd Unit A
- 58 Shady Ln
- 4 Rebecca Dr
- 233 Marion Rd
- Lot 77E Seahorse
- Lot 77D Seahorse
- 7 Seahorse Way
- 21 Weston Ave
- 245 Wareham Rd
- 4 Bachant Way
- 119 County Rd
- 127 County Rd
- 4 Blackhall Ct