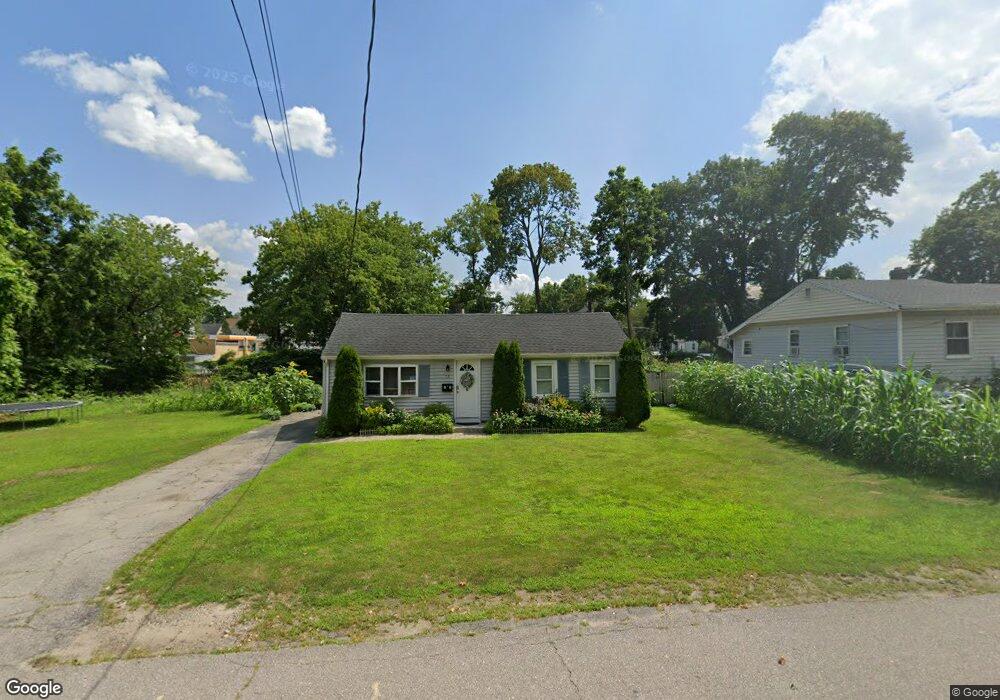
18 Packard Way Brockton, MA 02301
Clifton Heights NeighborhoodEstimated Value: $442,000 - $548,000
4
Beds
1
Bath
1,272
Sq Ft
$377/Sq Ft
Est. Value
About This Home
This home is located at 18 Packard Way, Brockton, MA 02301 and is currently estimated at $479,514, approximately $376 per square foot. 18 Packard Way is a home located in Plymouth County with nearby schools including John F. Kennedy Elementary School, Davis K-8 School, and South Middle School.
Ownership History
Date
Name
Owned For
Owner Type
Purchase Details
Closed on
Aug 30, 2018
Sold by
Wallace Christopher and Wallace Karen
Bought by
Ayala Soraya I and Landaverde Angelica M
Current Estimated Value
Home Financials for this Owner
Home Financials are based on the most recent Mortgage that was taken out on this home.
Original Mortgage
$260,200
Outstanding Balance
$227,653
Interest Rate
4.75%
Mortgage Type
FHA
Estimated Equity
$251,861
Purchase Details
Closed on
Sep 24, 2010
Sold by
Fnma
Bought by
Wallace Christopher and Wallace Karen
Purchase Details
Closed on
Jul 15, 2010
Sold by
Eldridge Victoria A
Bought by
Federal National Mortgage Association
Purchase Details
Closed on
Jul 28, 1995
Sold by
Brook Union Rt
Bought by
Eldridge Victoria A
Purchase Details
Closed on
Mar 21, 1995
Sold by
Longworth Inc
Bought by
Brook Union Rt
Purchase Details
Closed on
Feb 15, 1995
Sold by
Thomas Cynthia J
Bought by
Longworth Inc
Purchase Details
Closed on
Sep 23, 1991
Sold by
Peoples Sv Bk Brockton
Bought by
Thomas Cynthia J
Purchase Details
Closed on
Sep 19, 1990
Sold by
18 Packard Way Rt
Bought by
Peoples Sv Bk Brockton
Create a Home Valuation Report for This Property
The Home Valuation Report is an in-depth analysis detailing your home's value as well as a comparison with similar homes in the area
Home Values in the Area
Average Home Value in this Area
Purchase History
| Date | Buyer | Sale Price | Title Company |
|---|---|---|---|
| Ayala Soraya I | $265,000 | -- | |
| Wallace Christopher | $80,000 | -- | |
| Federal National Mortgage Association | $212,205 | -- | |
| Eldridge Victoria A | $75,000 | -- | |
| Brook Union Rt | $25,000 | -- | |
| Longworth Inc | $10,000 | -- | |
| Thomas Cynthia J | $75,000 | -- | |
| Peoples Sv Bk Brockton | $112,250 | -- |
Source: Public Records
Mortgage History
| Date | Status | Borrower | Loan Amount |
|---|---|---|---|
| Open | Ayala Soraya I | $260,200 | |
| Previous Owner | Peoples Sv Bk Brockton | $100,000 | |
| Previous Owner | Peoples Sv Bk Brockton | $94,737 |
Source: Public Records
Tax History Compared to Growth
Tax History
| Year | Tax Paid | Tax Assessment Tax Assessment Total Assessment is a certain percentage of the fair market value that is determined by local assessors to be the total taxable value of land and additions on the property. | Land | Improvement |
|---|---|---|---|---|
| 2025 | $4,404 | $363,700 | $140,200 | $223,500 |
| 2024 | $4,386 | $364,900 | $140,200 | $224,700 |
| 2023 | $4,472 | $344,500 | $104,700 | $239,800 |
| 2022 | $3,840 | $274,900 | $95,200 | $179,700 |
| 2021 | $3,727 | $257,000 | $79,100 | $177,900 |
| 2020 | $3,801 | $250,900 | $74,000 | $176,900 |
| 2019 | $3,402 | $218,900 | $72,200 | $146,700 |
| 2018 | $2,823 | $175,800 | $72,200 | $103,600 |
| 2017 | $2,721 | $169,000 | $72,200 | $96,800 |
| 2016 | $2,786 | $160,500 | $70,000 | $90,500 |
| 2015 | $2,603 | $143,400 | $70,000 | $73,400 |
| 2014 | $2,518 | $138,900 | $70,000 | $68,900 |
Source: Public Records
Map
Nearby Homes