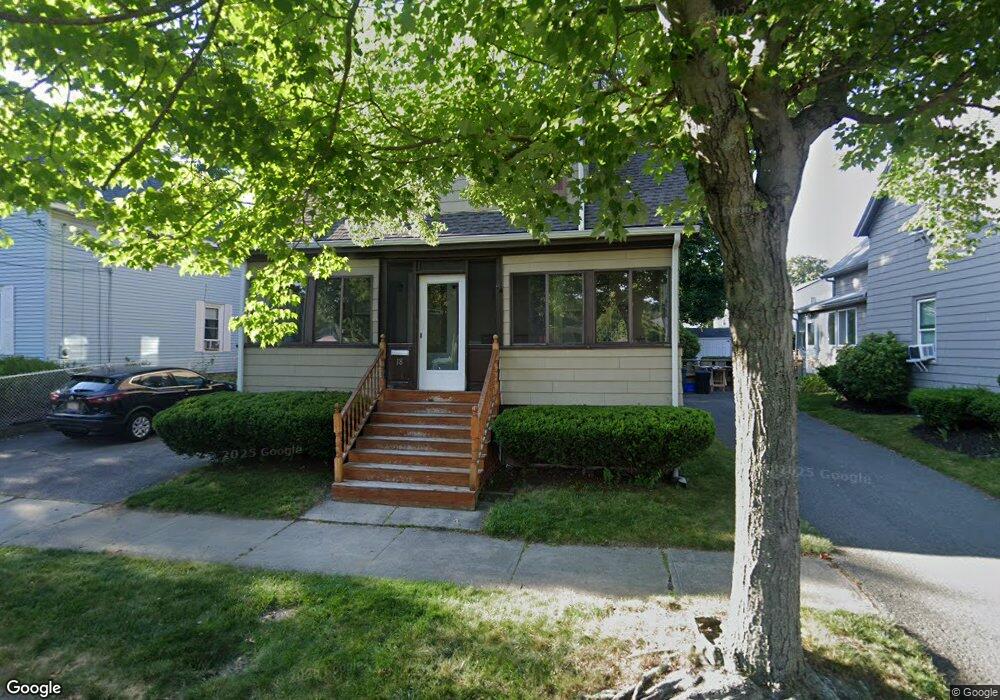
18 Pearson St Saugus, MA 01906
Downtown Saugus NeighborhoodEstimated Value: $573,309 - $639,000
3
Beds
1
Bath
1,206
Sq Ft
$510/Sq Ft
Est. Value
About This Home
This home is located at 18 Pearson St, Saugus, MA 01906 and is currently estimated at $614,577, approximately $509 per square foot. 18 Pearson St is a home located in Essex County with nearby schools including Saugus High School, Pioneer Charter School Of Science II, and Sacred Heart School.
Ownership History
Date
Name
Owned For
Owner Type
Purchase Details
Closed on
Oct 16, 2009
Sold by
Mackenzie Henry E and Mackenzie Barbara A
Bought by
Trainor Brian
Current Estimated Value
Home Financials for this Owner
Home Financials are based on the most recent Mortgage that was taken out on this home.
Original Mortgage
$287,201
Interest Rate
5.14%
Mortgage Type
Purchase Money Mortgage
Create a Home Valuation Report for This Property
The Home Valuation Report is an in-depth analysis detailing your home's value as well as a comparison with similar homes in the area
Home Values in the Area
Average Home Value in this Area
Purchase History
| Date | Buyer | Sale Price | Title Company |
|---|---|---|---|
| Trainor Brian | $292,500 | -- |
Source: Public Records
Mortgage History
| Date | Status | Borrower | Loan Amount |
|---|---|---|---|
| Open | Trainor Brian | $290,585 | |
| Closed | Trainor Brian | $287,201 | |
| Previous Owner | Trainor Brian | $103,000 |
Source: Public Records
Tax History
| Year | Tax Paid | Tax Assessment Tax Assessment Total Assessment is a certain percentage of the fair market value that is determined by local assessors to be the total taxable value of land and additions on the property. | Land | Improvement |
|---|---|---|---|---|
| 2025 | $5,573 | $521,800 | $314,500 | $207,300 |
| 2024 | $5,430 | $509,900 | $306,000 | $203,900 |
| 2023 | $5,248 | $466,100 | $267,800 | $198,300 |
| 2022 | $5,095 | $424,200 | $249,100 | $175,100 |
| 2021 | $4,556 | $369,200 | $206,600 | $162,600 |
| 2020 | $4,203 | $352,600 | $196,400 | $156,200 |
| 2019 | $4,180 | $343,200 | $187,000 | $156,200 |
| 2018 | $3,779 | $326,300 | $178,500 | $147,800 |
| 2017 | $3,585 | $297,500 | $170,000 | $127,500 |
| 2016 | $3,564 | $292,100 | $161,400 | $130,700 |
| 2015 | $3,344 | $278,200 | $153,700 | $124,500 |
| 2014 | $3,190 | $274,800 | $153,700 | $121,100 |
Source: Public Records
Map
Nearby Homes
Your Personal Tour Guide
Ask me questions while you tour the home.