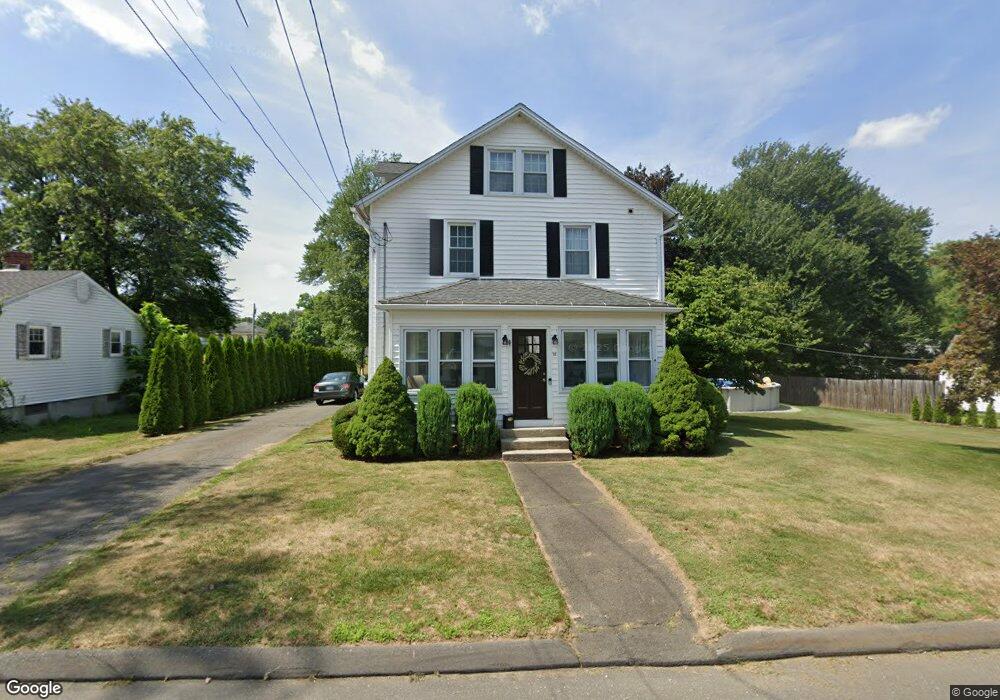
18 Poplar St Windsor Locks, CT 06096
Estimated Value: $337,000 - $379,000
3
Beds
2
Baths
1,612
Sq Ft
$222/Sq Ft
Est. Value
About This Home
This home is located at 18 Poplar St, Windsor Locks, CT 06096 and is currently estimated at $357,334, approximately $221 per square foot. 18 Poplar St is a home located in Hartford County with nearby schools including North Street School, South Elementary School, and Windsor Locks Middle School.
Ownership History
Date
Name
Owned For
Owner Type
Purchase Details
Closed on
Feb 10, 2014
Sold by
Royston Michael E
Bought by
Tria Amy
Current Estimated Value
Purchase Details
Closed on
Jan 21, 2005
Sold by
Ferland Fernard and Ferland Annette
Bought by
Royston Michael
Purchase Details
Closed on
Mar 1, 1994
Sold by
Settembri Ralph A
Bought by
Cole Eltha L
Create a Home Valuation Report for This Property
The Home Valuation Report is an in-depth analysis detailing your home's value as well as a comparison with similar homes in the area
Home Values in the Area
Average Home Value in this Area
Purchase History
| Date | Buyer | Sale Price | Title Company |
|---|---|---|---|
| Tria Amy | -- | -- | |
| Royston Michael | $208,000 | -- | |
| Cole Eltha L | $110,500 | -- |
Source: Public Records
Mortgage History
| Date | Status | Borrower | Loan Amount |
|---|---|---|---|
| Open | Cole Eltha L | $194,125 | |
| Previous Owner | Cole Eltha L | $188,575 | |
| Previous Owner | Cole Eltha L | $190,000 |
Source: Public Records
Tax History
| Year | Tax Paid | Tax Assessment Tax Assessment Total Assessment is a certain percentage of the fair market value that is determined by local assessors to be the total taxable value of land and additions on the property. | Land | Improvement |
|---|---|---|---|---|
| 2025 | $5,130 | $213,850 | $57,470 | $156,380 |
| 2024 | $3,343 | $118,790 | $44,170 | $74,620 |
| 2023 | $3,128 | $118,790 | $44,170 | $74,620 |
| 2022 | $3,068 | $118,790 | $44,170 | $74,620 |
| 2021 | $3,068 | $118,790 | $44,170 | $74,620 |
| 2020 | $3,068 | $118,790 | $44,170 | $74,620 |
| 2019 | $3,068 | $118,790 | $44,170 | $74,620 |
| 2017 | $3,229 | $121,100 | $43,700 | $77,400 |
| 2016 | $3,213 | $120,500 | $43,700 | $76,800 |
| 2015 | $3,228 | $120,500 | $43,700 | $76,800 |
| 2014 | $3,659 | $139,500 | $49,600 | $89,900 |
Source: Public Records
Map
Nearby Homes
- 22 Pearl St
- 1453 Suffield St
- 20 Pleasant St Unit 22
- 42 Chapman Chase Unit 42
- 15 Suffield St
- 22 Suffield St
- 12 Chester Dr
- 202 Reed Ave
- 0 N Water St Unit 24138494
- 0 N Water St Unit 24128295
- 0 N Water St Unit 24128294
- 0 N Water St Unit 24128288
- 0 N Water St
- 59 Elm St
- 64 Main St
- 660 East St S
- 4 Woodland Hollow St
- 32 Pleasant Rd
- 404 Woodland St
- 143 Bridge St
Your Personal Tour Guide
Ask me questions while you tour the home.