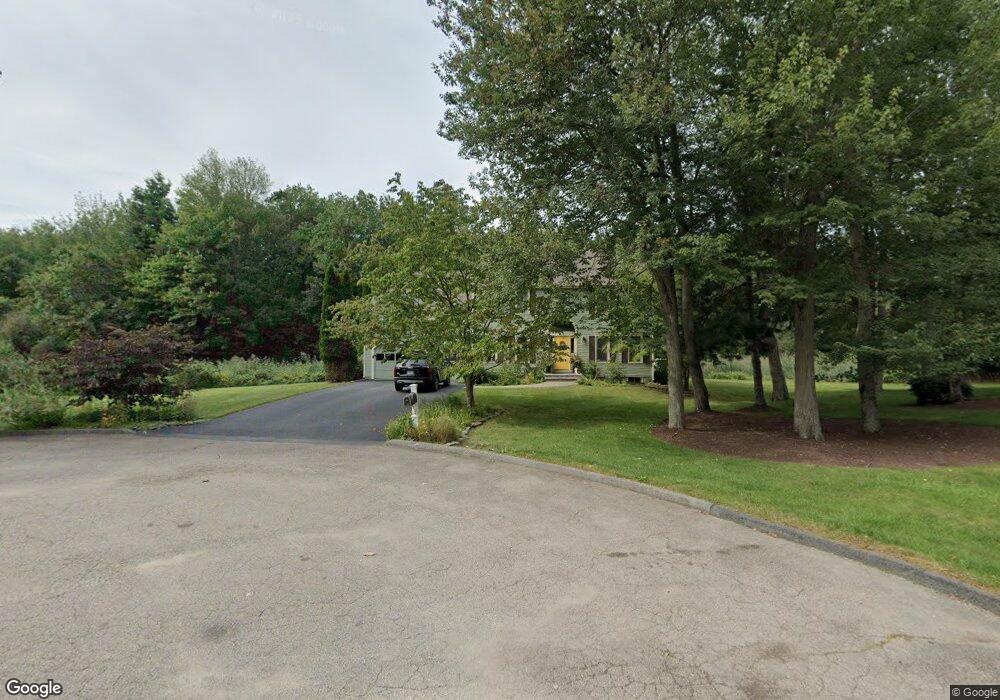
18 Quail Run Canton, MA 02021
Estimated Value: $1,129,000 - $1,262,000
4
Beds
3
Baths
2,552
Sq Ft
$464/Sq Ft
Est. Value
About This Home
This home is located at 18 Quail Run, Canton, MA 02021 and is currently estimated at $1,183,867, approximately $463 per square foot. 18 Quail Run is a home located in Norfolk County with nearby schools including Canton High School and St. John the Evangelist School.
Ownership History
Date
Name
Owned For
Owner Type
Purchase Details
Closed on
Jul 9, 2021
Sold by
Kozak Andrew A and Kozak Christine H
Bought by
Ollquist Daniel and Trubiano Sara
Current Estimated Value
Home Financials for this Owner
Home Financials are based on the most recent Mortgage that was taken out on this home.
Original Mortgage
$794,892
Outstanding Balance
$721,241
Interest Rate
2.9%
Mortgage Type
Purchase Money Mortgage
Estimated Equity
$462,626
Purchase Details
Closed on
Jun 27, 1994
Sold by
Flynn James J and Flynn Christine
Bought by
Kozak Andrew A and Kozak Christine H
Purchase Details
Closed on
Jan 24, 1989
Sold by
Can & Four Corp
Bought by
Flynn James J
Create a Home Valuation Report for This Property
The Home Valuation Report is an in-depth analysis detailing your home's value as well as a comparison with similar homes in the area
Home Values in the Area
Average Home Value in this Area
Purchase History
| Date | Buyer | Sale Price | Title Company |
|---|---|---|---|
| Ollquist Daniel | $987,500 | None Available | |
| Kozak Andrew A | $319,000 | -- | |
| Flynn James J | $320,000 | -- |
Source: Public Records
Mortgage History
| Date | Status | Borrower | Loan Amount |
|---|---|---|---|
| Open | Ollquist Daniel | $794,892 | |
| Previous Owner | Flynn James J | $180,000 | |
| Previous Owner | Flynn James J | $285,500 | |
| Previous Owner | Flynn James J | $300,000 |
Source: Public Records
Tax History
| Year | Tax Paid | Tax Assessment Tax Assessment Total Assessment is a certain percentage of the fair market value that is determined by local assessors to be the total taxable value of land and additions on the property. | Land | Improvement |
|---|---|---|---|---|
| 2025 | $10,024 | $1,013,500 | $417,500 | $596,000 |
| 2024 | $9,795 | $982,400 | $401,500 | $580,900 |
| 2023 | $9,315 | $881,300 | $401,500 | $479,800 |
| 2022 | $9,295 | $818,900 | $382,300 | $436,600 |
| 2021 | $9,110 | $746,700 | $347,600 | $399,100 |
| 2020 | $8,851 | $723,700 | $343,300 | $380,400 |
| 2019 | $8,665 | $698,800 | $312,000 | $386,800 |
| 2018 | $8,410 | $677,100 | $300,000 | $377,100 |
| 2017 | $8,495 | $664,200 | $294,200 | $370,000 |
| 2016 | $8,292 | $648,300 | $287,000 | $361,300 |
| 2015 | $8,089 | $631,000 | $278,700 | $352,300 |
Source: Public Records
Map
Nearby Homes
- 630 Pleasant St
- 611 Pleasant St
- 4 Jeffrey Rd
- 859 Pleasant St
- 23 Pine St Unit K
- 19 Pine St Unit K
- 60 Coppersmith Way Unit 304
- 20 Audubon Way Unit 205
- 20 Audubon Way Unit 302
- 20 Audubon Way Unit 109
- 20 Audubon Way Unit 408
- 20 Audubon Way Unit 210
- 20 Audubon Way Unit 104
- 20 Audubon Way Unit 101
- 55 Will Dr Unit 152
- 6 Audubon Way Unit 6
- 8 Audubon Way
- 26 Pequit St
- 42 Will Dr Unit 49
- 865 Washington St Unit 6
- 14 Quail Run
- 22 Quail Run
- 15 Pheasant Ridge Rd
- 15 Quail Run
- 19 Pheasant Ridge Rd
- 9 Quail Run
- 10 Quail Run
- 23 Pheasant Ridge Rd
- 6 Pheasant Ridge Rd
- 50 Angela St
- 7 Quail Run
- 7 Quail Run Unit 9
- 46 Angela St
- 10 Pheasant Ridge Rd
- 2 Pheasant Ridge Rd
- 54 Angela St
- 6 Quail Run
- 18 Pheasant Ridge Rd
- 42 Angela St
- 22 Pheasant Ridge Rd
Your Personal Tour Guide
Ask me questions while you tour the home.