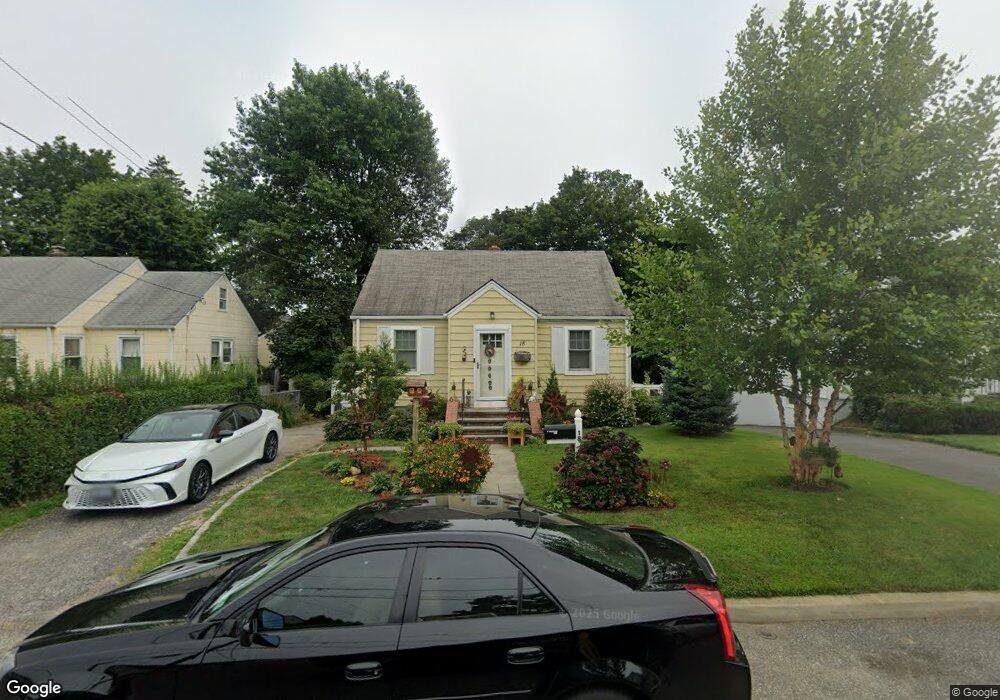
18 Raymond St Glen Cove, NY 11542
Estimated Value: $577,284 - $655,000
3
Beds
1
Bath
1,109
Sq Ft
$556/Sq Ft
Est. Value
About This Home
This home is located at 18 Raymond St, Glen Cove, NY 11542 and is currently estimated at $616,142, approximately $555 per square foot. 18 Raymond St is a home located in Nassau County with nearby schools including Robert M Finley Middle School, Glen Cove High School, and Tiegerman Elementary School.
Ownership History
Date
Name
Owned For
Owner Type
Purchase Details
Closed on
Oct 25, 2021
Sold by
Pascucci Lawrence M and Pascucci Christine
Bought by
Pascucci Lawrence M and Pascucci Christine
Current Estimated Value
Home Financials for this Owner
Home Financials are based on the most recent Mortgage that was taken out on this home.
Original Mortgage
$375,000
Outstanding Balance
$343,623
Interest Rate
2.99%
Mortgage Type
New Conventional
Estimated Equity
$272,519
Purchase Details
Closed on
May 29, 2020
Sold by
Ciampi Anthony
Bought by
Pascucci Lawrence M and Pascucci Christine
Home Financials for this Owner
Home Financials are based on the most recent Mortgage that was taken out on this home.
Original Mortgage
$333,000
Interest Rate
3.2%
Mortgage Type
New Conventional
Purchase Details
Closed on
Aug 22, 2005
Sold by
Sujeski Robert
Bought by
Ciampi Anthony
Purchase Details
Closed on
Aug 7, 2003
Sold by
Dorman Frederick
Bought by
Smith Erinlinn
Create a Home Valuation Report for This Property
The Home Valuation Report is an in-depth analysis detailing your home's value as well as a comparison with similar homes in the area
Home Values in the Area
Average Home Value in this Area
Purchase History
| Date | Buyer | Sale Price | Title Company |
|---|---|---|---|
| Pascucci Lawrence M | -- | Judicial Title | |
| Pascucci Lawrence M | $370,000 | None Available | |
| Ciampi Anthony | $400,000 | -- | |
| Smith Erinlinn | $285,000 | -- |
Source: Public Records
Mortgage History
| Date | Status | Borrower | Loan Amount |
|---|---|---|---|
| Open | Pascucci Lawrence M | $375,000 | |
| Closed | Pascucci Lawrence M | $333,000 |
Source: Public Records
Tax History Compared to Growth
Tax History
| Year | Tax Paid | Tax Assessment Tax Assessment Total Assessment is a certain percentage of the fair market value that is determined by local assessors to be the total taxable value of land and additions on the property. | Land | Improvement |
|---|---|---|---|---|
| 2025 | $613 | $322 | $171 | $151 |
| 2024 | $694 | $322 | $171 | $151 |
| 2023 | $2,050 | $322 | $171 | $151 |
| 2022 | $705 | $322 | $171 | $151 |
| 2021 | $5,627 | $312 | $166 | $146 |
| 2020 | $5,435 | $684 | $648 | $36 |
| 2019 | $1,860 | $684 | $648 | $36 |
| 2018 | $735 | $684 | $0 | $0 |
| 2017 | $735 | $684 | $648 | $36 |
| 2016 | $735 | $684 | $648 | $36 |
| 2015 | $740 | $684 | $648 | $36 |
| 2014 | $740 | $684 | $648 | $36 |
| 2013 | $702 | $684 | $648 | $36 |
Source: Public Records
Map
Nearby Homes
- 36 Red Spring Ln
- 11 Willada Ln
- 10 Valentine St
- 2 Gail Terrace
- 19 Ellwood St
- 46 Coles St
- 2 High Pine
- 106 Mcloughlin St
- 3 Fairview Ln
- 53 Pembroke Dr
- 78 Crescent Beach Rd
- 8 Jackson St
- 704 Breton Way Unit 704
- 50 Jerome Dr
- 10 Hickory Ln
- 512 Breton Way
- 28 Whitney Cir
- 48 Pembroke Dr
- 209 Breton Way
- 36 Woolsey Ave