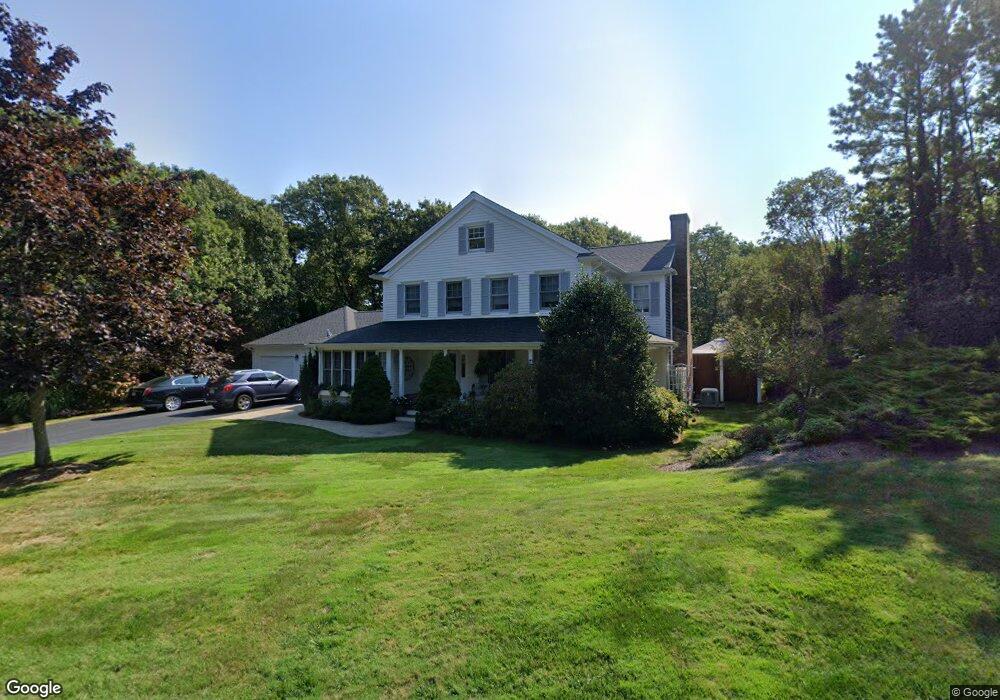
18 Red Oak Ln West Barnstable, MA 02668
West Barnstable NeighborhoodEstimated Value: $966,000 - $1,006,000
4
Beds
3
Baths
2,614
Sq Ft
$375/Sq Ft
Est. Value
About This Home
This home is located at 18 Red Oak Ln, West Barnstable, MA 02668 and is currently estimated at $981,227, approximately $375 per square foot. 18 Red Oak Ln is a home located in Barnstable County with nearby schools including Barnstable United Elementary School, West Barnstable Elementary School, and Barnstable Intermediate School.
Ownership History
Date
Name
Owned For
Owner Type
Purchase Details
Closed on
Apr 17, 2007
Sold by
Seaview Rt and Ward Frank M
Bought by
Tzellas Lisa M
Current Estimated Value
Home Financials for this Owner
Home Financials are based on the most recent Mortgage that was taken out on this home.
Original Mortgage
$200,000
Outstanding Balance
$121,523
Interest Rate
6.24%
Mortgage Type
Purchase Money Mortgage
Estimated Equity
$859,704
Purchase Details
Closed on
Nov 28, 2006
Sold by
Joyce Debra A and Joyce Michael F
Bought by
Seaview Rt and Ward Frank M
Purchase Details
Closed on
Dec 29, 1997
Sold by
Tortorello Linda A
Bought by
Joyce Michael F and Joyce Debra A
Purchase Details
Closed on
Nov 12, 1992
Sold by
Cape Cod B&T Co
Bought by
Tortorello Nicholas D and Tortorello Linda A
Create a Home Valuation Report for This Property
The Home Valuation Report is an in-depth analysis detailing your home's value as well as a comparison with similar homes in the area
Home Values in the Area
Average Home Value in this Area
Purchase History
| Date | Buyer | Sale Price | Title Company |
|---|---|---|---|
| Tzellas Lisa M | $275,000 | -- | |
| Seaview Rt | $565,000 | -- | |
| Joyce Michael F | $216,500 | -- | |
| Tortorello Nicholas D | $38,500 | -- |
Source: Public Records
Mortgage History
| Date | Status | Borrower | Loan Amount |
|---|---|---|---|
| Open | Tzellas Lisa M | $200,000 | |
| Previous Owner | Tortorello Nicholas D | $100,000 | |
| Previous Owner | Tortorello Nicholas D | $155,000 | |
| Previous Owner | Tortorello Nicholas D | $30,000 |
Source: Public Records
Tax History
| Year | Tax Paid | Tax Assessment Tax Assessment Total Assessment is a certain percentage of the fair market value that is determined by local assessors to be the total taxable value of land and additions on the property. | Land | Improvement |
|---|---|---|---|---|
| 2025 | $8,418 | $901,300 | $176,600 | $724,700 |
| 2024 | $7,429 | $865,900 | $176,600 | $689,300 |
| 2023 | $6,943 | $762,100 | $160,600 | $601,500 |
| 2022 | $6,887 | $619,900 | $119,100 | $500,800 |
| 2021 | $1,708 | $577,900 | $119,100 | $458,800 |
| 2020 | $1,716 | $515,500 | $126,900 | $388,600 |
| 2019 | $6,403 | $521,400 | $126,900 | $394,500 |
| 2018 | $5,934 | $478,900 | $133,500 | $345,400 |
| 2017 | $5,771 | $471,500 | $133,500 | $338,000 |
| 2016 | $5,629 | $469,500 | $137,100 | $332,400 |
| 2015 | $5,430 | $454,000 | $127,400 | $326,600 |
Source: Public Records
Map
Nearby Homes
- 84 White Birch Way
- 80 Branch Terrace
- 74 Saddler Ln
- 32 Willington Ave
- 1028 Old Falmouth Rd
- 87 Foxglove Rd
- 282 Parker Rd
- 62 Three Ponds Dr
- 324 Patriot Way
- 510 Cedar St
- 192 Sandy Valley Rd
- 75 Old Toll Rd
- 900 Old Stage Rd
- 315 Prince Hinckley Rd
- 7 Ebenezer
- 296 Buckskin Path
- 50 Wayside Ln
- 23 Middle Pond Path
- 66 Tern Ln
- 159 Great Hill Rd
- 1730 Osterville Rd
- 1733 Osterville Rd
- 1730 Osterville West Barnstable Rd
- 25 Red Oak Ln
- 1733 Ost-W Barn Rd
- 1696 Osterville West Barnstabl
- 9 Red Oak Ln
- 1756 Osterville Rd
- 45 Red Oak Ln
- 15 Pioneer Path
- 5 Pioneer Path
- 1756 Osterville West Barnstable Rd
- 67 Red Oak Ln
- 0 Pioneer Point
- 40 Pioneer Path
- 19 White Birch Way
- 1671 Osterville Rd
- 55 Pioneer Path
- 99 Red Oak Ln
- 1680 Osterville Rd
Your Personal Tour Guide
Ask me questions while you tour the home.