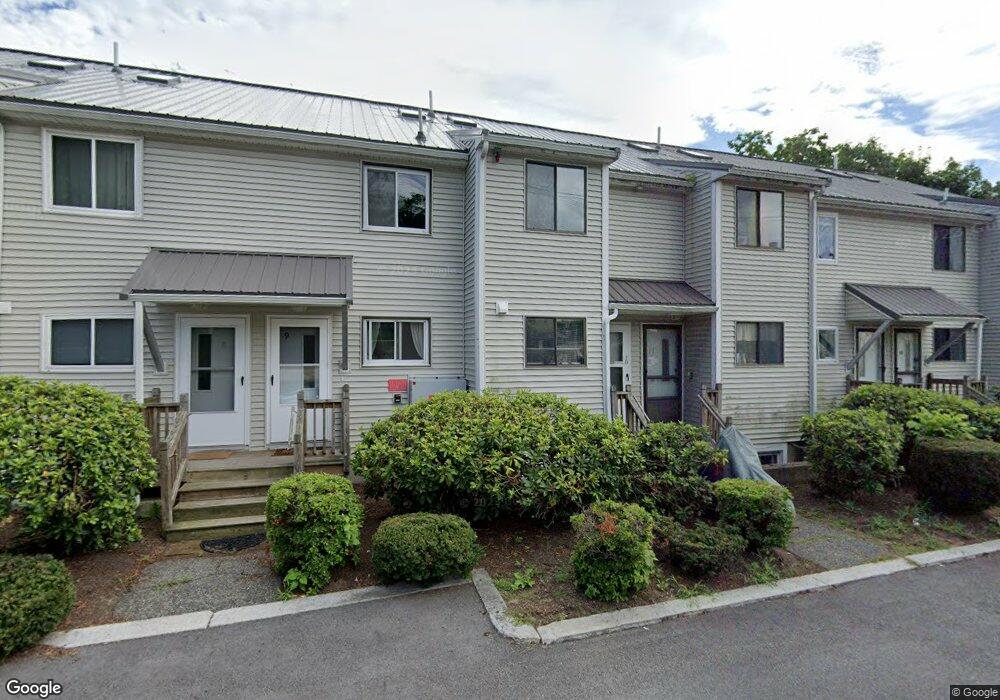
18 River St Unit 24 Hudson, MA 01749
Downtown Hudson NeighborhoodEstimated Value: $220,000 - $330,000
2
Beds
2
Baths
825
Sq Ft
$355/Sq Ft
Est. Value
About This Home
This home is located at 18 River St Unit 24, Hudson, MA 01749 and is currently estimated at $292,925, approximately $355 per square foot. 18 River St Unit 24 is a home located in Middlesex County with nearby schools including David J. Quinn Middle School, Hudson High School, and First Steps Children's Center.
Ownership History
Date
Name
Owned For
Owner Type
Purchase Details
Closed on
Aug 27, 2019
Sold by
Morales Margarita
Bought by
Massaglia Sharon M
Current Estimated Value
Purchase Details
Closed on
Dec 6, 2013
Sold by
Houseman Colleen
Bought by
Morales Margarita
Purchase Details
Closed on
Oct 6, 2009
Sold by
Ash Edward L
Bought by
Houseman Colleen
Home Financials for this Owner
Home Financials are based on the most recent Mortgage that was taken out on this home.
Original Mortgage
$142,864
Interest Rate
5.12%
Mortgage Type
Purchase Money Mortgage
Purchase Details
Closed on
Sep 21, 2006
Sold by
Gatteny Cherlyann and Lento Kim
Bought by
Ash Edward and Ash Melissa
Home Financials for this Owner
Home Financials are based on the most recent Mortgage that was taken out on this home.
Original Mortgage
$140,000
Interest Rate
6.59%
Mortgage Type
Purchase Money Mortgage
Create a Home Valuation Report for This Property
The Home Valuation Report is an in-depth analysis detailing your home's value as well as a comparison with similar homes in the area
Home Values in the Area
Average Home Value in this Area
Purchase History
| Date | Buyer | Sale Price | Title Company |
|---|---|---|---|
| Massaglia Sharon M | $185,000 | -- | |
| Morales Margarita | $143,500 | -- | |
| Houseman Colleen | $145,500 | -- | |
| Ash Edward | $175,000 | -- |
Source: Public Records
Mortgage History
| Date | Status | Borrower | Loan Amount |
|---|---|---|---|
| Previous Owner | Houseman Colleen | $142,864 | |
| Previous Owner | Ash Edward | $140,000 |
Source: Public Records
Tax History Compared to Growth
Tax History
| Year | Tax Paid | Tax Assessment Tax Assessment Total Assessment is a certain percentage of the fair market value that is determined by local assessors to be the total taxable value of land and additions on the property. | Land | Improvement |
|---|---|---|---|---|
| 2025 | $4,056 | $292,200 | $0 | $292,200 |
| 2024 | $2,548 | $182,000 | $0 | $182,000 |
| 2023 | $2,340 | $160,300 | $0 | $160,300 |
| 2022 | $2,312 | $145,800 | $0 | $145,800 |
| 2021 | $2,852 | $171,900 | $0 | $171,900 |
| 2020 | $2,739 | $164,900 | $0 | $164,900 |
| 2019 | $2,670 | $156,800 | $0 | $156,800 |
| 2018 | $2,315 | $152,800 | $0 | $152,800 |
| 2017 | $2,335 | $133,400 | $0 | $133,400 |
| 2016 | $2,500 | $144,600 | $0 | $144,600 |
| 2015 | $2,193 | $127,000 | $0 | $127,000 |
| 2014 | $2,240 | $128,600 | $0 | $128,600 |
Source: Public Records
Map
Nearby Homes
- 18-24 River St Unit 1
- 65 Main St
- 18 Cottage St
- 17 School St Unit C
- 17 School St Unit A
- 4 Linden St
- 56 Park St
- 55 Cottage St
- 21 Gates Ave
- 30 Maple St
- 248 Main St Unit 207
- 248 Main St Unit 216
- 32 Oak St
- 250 Main St Unit 316
- 250 Main St Unit 317
- 104 Lincoln St
- 19 1st St
- 168 River Rd E Unit Lot 15A
- 168 River Rd E Unit Lot 5
- 168 River Rd E Unit Lot 3
- 18 River St Unit 24
- 18 River St Unit 24
- 18 River St Unit 24
- 18 River St Unit 24
- 18 River St Unit 24
- 18 River St Unit 24
- 18 River St Unit 24
- 18 River St Unit 24
- 18 River St Unit 24
- 18 River St Unit 24
- 18 River St Unit 24
- 18 River St Unit 24
- 18 River St Unit 24
- 18 River St Unit 6
- 22 River St Unit 11
- 22 River St Unit 9
- 22 River St Unit 12
- 22 River St Unit 10
- 22 River St Unit 1
- 22 River St Unit 6