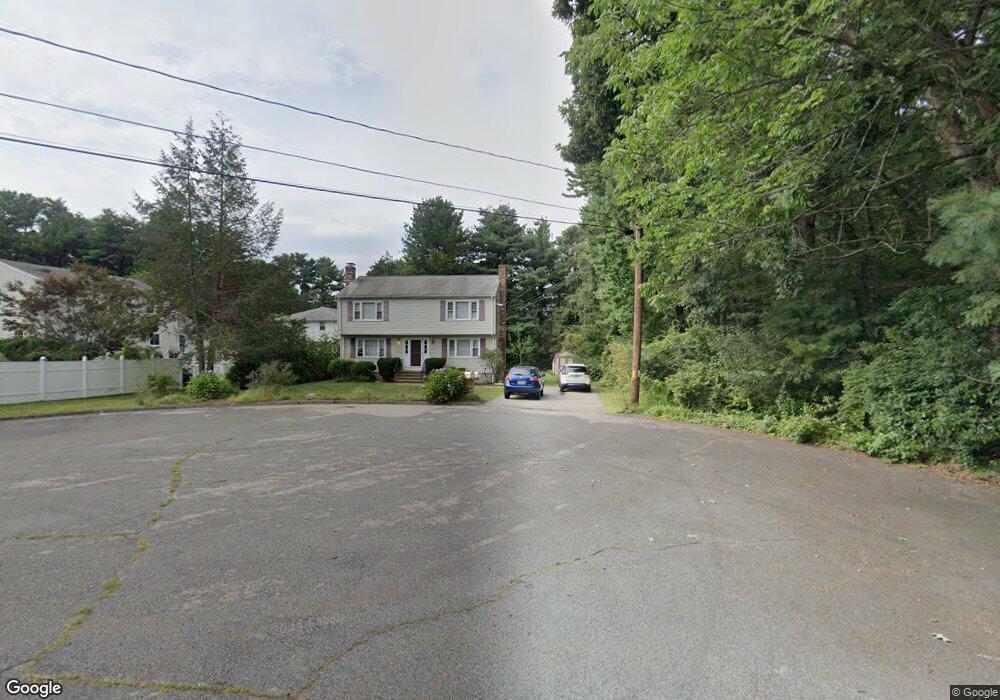
18 Robert St Walpole, MA 02081
Estimated Value: $399,682 - $504,000
2
Beds
2
Baths
936
Sq Ft
$480/Sq Ft
Est. Value
About This Home
This home is located at 18 Robert St, Walpole, MA 02081 and is currently estimated at $449,671, approximately $480 per square foot. 18 Robert St is a home located in Norfolk County with nearby schools including Fisher School, Walpole Middle School, and Walpole High School.
Ownership History
Date
Name
Owned For
Owner Type
Purchase Details
Closed on
Mar 29, 2002
Sold by
Byrne Daniel J and Byrne Lisa A
Bought by
Fitzpatrick Bridget T
Current Estimated Value
Purchase Details
Closed on
Mar 30, 1995
Sold by
Folcik Joan A
Bought by
Byrne Daniel J and Byrne Lisa A
Home Financials for this Owner
Home Financials are based on the most recent Mortgage that was taken out on this home.
Original Mortgage
$96,500
Interest Rate
8.8%
Mortgage Type
Purchase Money Mortgage
Create a Home Valuation Report for This Property
The Home Valuation Report is an in-depth analysis detailing your home's value as well as a comparison with similar homes in the area
Home Values in the Area
Average Home Value in this Area
Purchase History
| Date | Buyer | Sale Price | Title Company |
|---|---|---|---|
| Fitzpatrick Bridget T | $214,900 | -- | |
| Byrne Daniel J | $121,500 | -- |
Source: Public Records
Mortgage History
| Date | Status | Borrower | Loan Amount |
|---|---|---|---|
| Previous Owner | Byrne Daniel J | $96,500 |
Source: Public Records
Tax History
| Year | Tax Paid | Tax Assessment Tax Assessment Total Assessment is a certain percentage of the fair market value that is determined by local assessors to be the total taxable value of land and additions on the property. | Land | Improvement |
|---|---|---|---|---|
| 2025 | $4,594 | $358,100 | $0 | $358,100 |
| 2024 | $4,425 | $334,700 | $0 | $334,700 |
| 2023 | $4,266 | $307,100 | $0 | $307,100 |
| 2022 | $4,037 | $279,200 | $0 | $279,200 |
| 2021 | $4,023 | $271,100 | $0 | $271,100 |
| 2020 | $3,830 | $255,500 | $0 | $255,500 |
| 2019 | $3,746 | $248,100 | $0 | $248,100 |
| 2018 | $3,575 | $234,100 | $0 | $234,100 |
| 2017 | $3,485 | $227,300 | $0 | $227,300 |
| 2016 | $3,467 | $222,800 | $0 | $222,800 |
| 2015 | $3,361 | $214,100 | $0 | $214,100 |
| 2014 | $3,310 | $210,000 | $0 | $210,000 |
Source: Public Records
Map
Nearby Homes
- 881 Main St Unit 5
- 2301 Pennington Dr Unit 2301
- 24 Gristmill Ln
- 1108 Pennington Dr Unit 1108
- 65-67 Diamond St
- 19 and 23 Arlington Ln
- 700 East St Unit L
- 8 Old Fisher Ln
- 11 Hoover Rd
- 7 Tanglewood Rd
- 316 Fisher St
- 26 Dover Dr
- 29 Clapp St
- 6 Teal Cir
- 86 Alton St
- 124 Clear Pond Dr
- 31 Pintail Rd
- 131 Carpenter Rd
- 2 Sterling Ln Unit 2
- 269 Bullard St
Your Personal Tour Guide
Ask me questions while you tour the home.