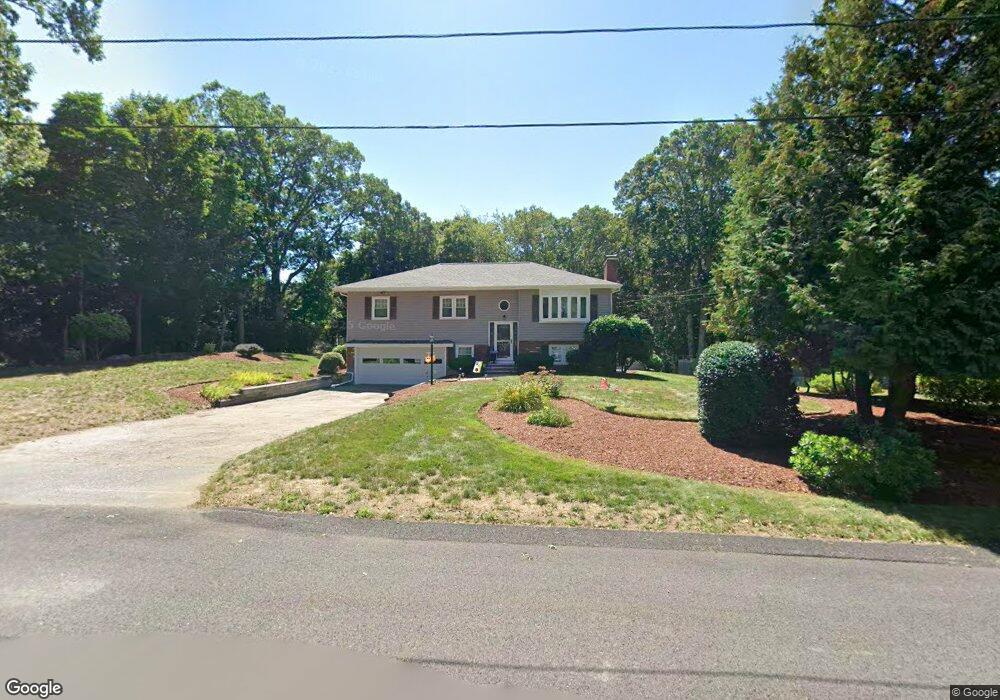
18 Ryder Rd North Attleboro, MA 02760
North Attleboro NeighborhoodEstimated Value: $583,000 - $615,000
3
Beds
2
Baths
1,257
Sq Ft
$472/Sq Ft
Est. Value
About This Home
This home is located at 18 Ryder Rd, North Attleboro, MA 02760 and is currently estimated at $592,861, approximately $471 per square foot. 18 Ryder Rd is a home located in Bristol County with nearby schools including North Attleboro High School and Cadence Academy Preschool - North Attleborough.
Ownership History
Date
Name
Owned For
Owner Type
Purchase Details
Closed on
May 15, 2024
Sold by
Direnzo Sheila A and Franco Elaine J
Bought by
Direnzo Sheila A and Franco Elaine J
Current Estimated Value
Purchase Details
Closed on
Oct 6, 2016
Sold by
Direnzo Peter J
Bought by
Direnzo Sheila A and Franco Elaine J
Create a Home Valuation Report for This Property
The Home Valuation Report is an in-depth analysis detailing your home's value as well as a comparison with similar homes in the area
Home Values in the Area
Average Home Value in this Area
Purchase History
| Date | Buyer | Sale Price | Title Company |
|---|---|---|---|
| Direnzo Sheila A | -- | None Available | |
| Direnzo Sheila A | -- | None Available | |
| Direnzo Sheila A | -- | -- | |
| Direnzo Sheila A | -- | -- |
Source: Public Records
Mortgage History
| Date | Status | Borrower | Loan Amount |
|---|---|---|---|
| Previous Owner | Direnzo Sheila A | $25,000 |
Source: Public Records
Tax History Compared to Growth
Tax History
| Year | Tax Paid | Tax Assessment Tax Assessment Total Assessment is a certain percentage of the fair market value that is determined by local assessors to be the total taxable value of land and additions on the property. | Land | Improvement |
|---|---|---|---|---|
| 2025 | $6,376 | $540,800 | $149,200 | $391,600 |
| 2024 | $6,094 | $528,100 | $149,200 | $378,900 |
| 2023 | $6,050 | $473,000 | $149,200 | $323,800 |
| 2022 | $5,823 | $418,000 | $149,200 | $268,800 |
| 2021 | $3,985 | $382,500 | $149,200 | $233,300 |
| 2020 | $5,314 | $370,300 | $149,200 | $221,100 |
| 2019 | $5,081 | $356,800 | $135,700 | $221,100 |
| 2018 | $4,526 | $339,300 | $135,700 | $203,600 |
| 2017 | $4,324 | $327,100 | $135,700 | $191,400 |
| 2016 | $4,225 | $319,600 | $150,700 | $168,900 |
| 2015 | $3,945 | $300,200 | $150,700 | $149,500 |
| 2014 | $3,726 | $281,400 | $132,300 | $149,100 |
Source: Public Records
Map
Nearby Homes
- 1066 Mount Hope St
- 8 Al Pace Dr Unit 8
- 64 Smith St
- 3 Serengeti Dr
- 212 Fisher St Unit A5
- 217 Fisher St
- 35-R Whiting St
- 633 E Washington St Unit 17
- 633 E Washington St Unit 10
- 68 Fisher St
- 12 Houde St
- 45 Moran St
- 0 Landry 2nd Unit 73350867
- 880 Landry Ave Unit 2
- 42 2nd Ave Unit 24
- 20 South St
- 711 Mount Hope St Unit 7
- 711 Mount Hope St Unit 6
- 711 Mount Hope St Unit 8
- 711 Mount Hope St Unit 5