18 S Lenox St Worcester, MA 01602
Newton Square NeighborhoodEstimated Value: $546,553 - $589,000
4
Beds
2
Baths
2,200
Sq Ft
$257/Sq Ft
Est. Value
About This Home
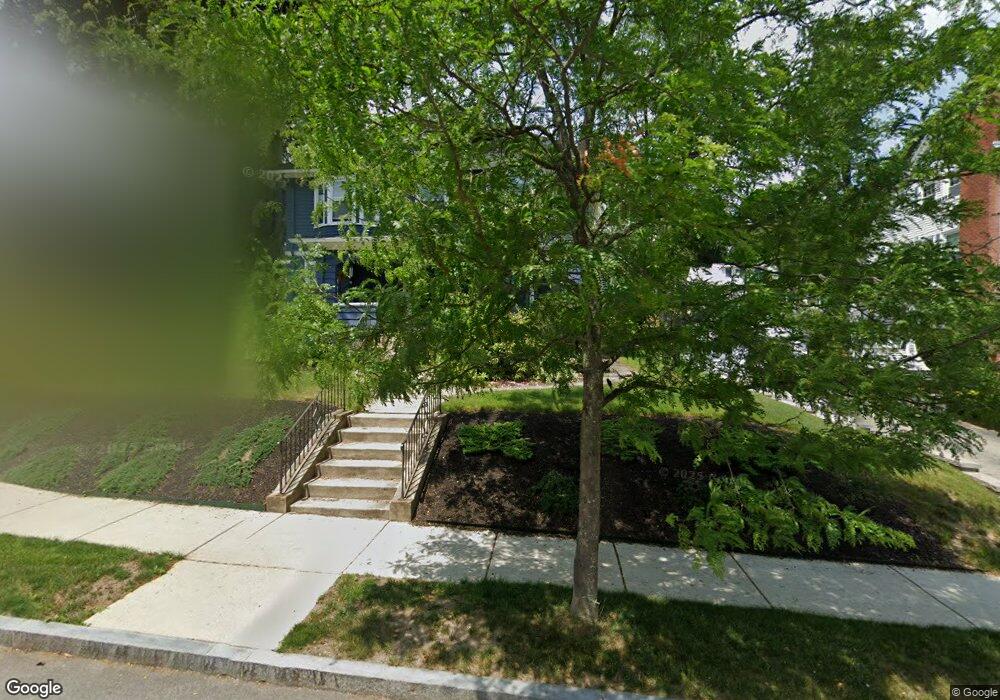
This home is located at 18 S Lenox St, Worcester, MA 01602 and is currently estimated at $566,388, approximately $257 per square foot. 18 S Lenox St is a home located in Worcester County with nearby schools including Chandler Magnet, Jacob Hiatt Magnet School, and Midland Street.
Ownership History
Date
Name
Owned For
Owner Type
Purchase Details
Closed on
Sep 16, 2002
Sold by
Reitz Andrew L and Brown Rebecca S
Bought by
Saunders Karim Ben
Current Estimated Value
Home Financials for this Owner
Home Financials are based on the most recent Mortgage that was taken out on this home.
Original Mortgage
$238,900
Outstanding Balance
$101,543
Interest Rate
6.48%
Mortgage Type
Purchase Money Mortgage
Estimated Equity
$464,845
Purchase Details
Closed on
Feb 28, 1996
Sold by
Dooley Joseph
Bought by
Brown Rebecca S and Reitz Andrew
Home Financials for this Owner
Home Financials are based on the most recent Mortgage that was taken out on this home.
Original Mortgage
$106,400
Interest Rate
7.02%
Mortgage Type
Purchase Money Mortgage
Create a Home Valuation Report for This Property
The Home Valuation Report is an in-depth analysis detailing your home's value as well as a comparison with similar homes in the area
Home Values in the Area
Average Home Value in this Area
Purchase History
| Date | Buyer | Sale Price | Title Company |
|---|---|---|---|
| Saunders Karim Ben | $251,500 | -- | |
| Brown Rebecca S | $133,000 | -- |
Source: Public Records
Mortgage History
| Date | Status | Borrower | Loan Amount |
|---|---|---|---|
| Open | Brown Rebecca S | $238,900 | |
| Previous Owner | Brown Rebecca S | $106,400 |
Source: Public Records
Tax History
| Year | Tax Paid | Tax Assessment Tax Assessment Total Assessment is a certain percentage of the fair market value that is determined by local assessors to be the total taxable value of land and additions on the property. | Land | Improvement |
|---|---|---|---|---|
| 2025 | $6,516 | $494,000 | $118,000 | $376,000 |
| 2024 | $6,358 | $462,400 | $118,000 | $344,400 |
| 2023 | $6,127 | $427,300 | $102,600 | $324,700 |
| 2022 | $5,676 | $373,200 | $82,100 | $291,100 |
| 2021 | $5,654 | $347,300 | $65,700 | $281,600 |
| 2020 | $5,455 | $320,900 | $65,700 | $255,200 |
| 2019 | $5,459 | $303,300 | $59,100 | $244,200 |
| 2018 | $5,386 | $284,800 | $59,100 | $225,700 |
| 2017 | $5,157 | $268,300 | $59,100 | $209,200 |
| 2016 | $5,188 | $251,700 | $43,100 | $208,600 |
| 2015 | $5,052 | $251,700 | $43,100 | $208,600 |
| 2014 | $4,910 | $251,300 | $43,100 | $208,200 |
Source: Public Records
Map
Nearby Homes
- 19 Kenilworth Rd
- 31 Lenox St
- 18 Hadwen Ln
- 16 Sherwood Rd
- 3A Chalmers Rd
- 7 Longworth Rd
- 24 Hadwen Rd
- 22 Audubon Rd
- 6 Newton Ave
- 60 June St
- 19 Highland Terrace
- 83 Newton Ave N
- 93 Newton Ave N
- 108 Longfellow Rd
- 3 Suburban Rd
- 33 Carlisle St
- 12 Cardinal Rd
- 32 Zenith Dr
- 18 Merlin Ct Unit 18
- 15 Longfellow Rd
Your Personal Tour Guide
Ask me questions while you tour the home.