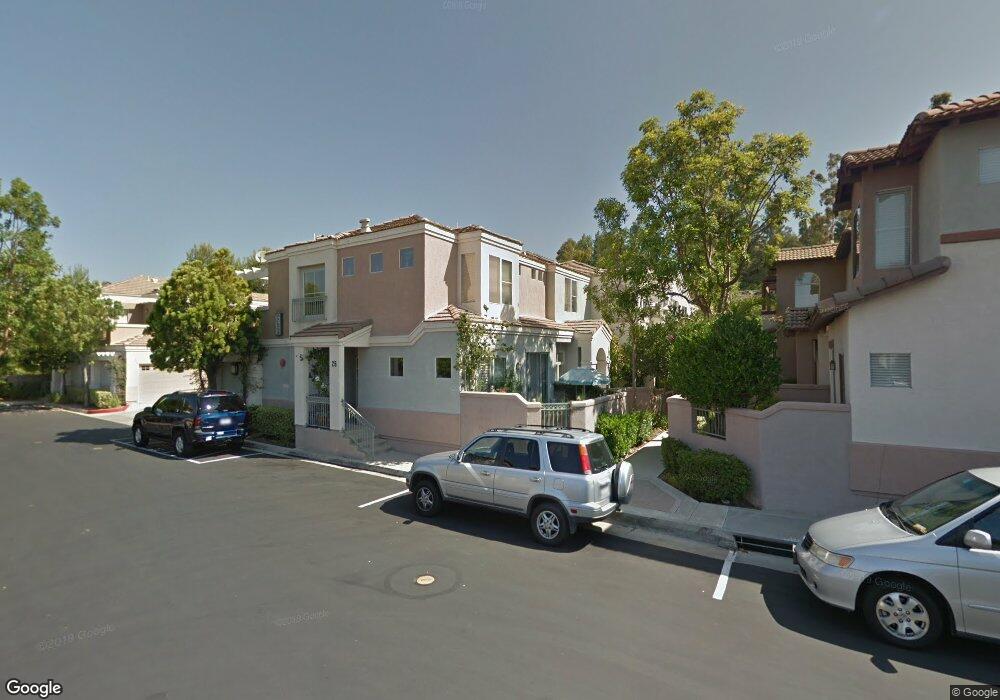
18 Santa Barbara Ct Foothill Ranch, CA 92610
Estimated Value: $755,067 - $773,000
2
Beds
3
Baths
1,222
Sq Ft
$625/Sq Ft
Est. Value
About This Home
This home is located at 18 Santa Barbara Ct, Foothill Ranch, CA 92610 and is currently estimated at $763,517, approximately $624 per square foot. 18 Santa Barbara Ct is a home located in Orange County with nearby schools including Foothill Ranch Elementary School, Rancho Santa Margarita Intermediate School, and Trabuco Hills High School.
Ownership History
Date
Name
Owned For
Owner Type
Purchase Details
Closed on
May 19, 2008
Sold by
Wallace Mark Richard and Wallace Anissa Dawn
Bought by
Park Joanne
Current Estimated Value
Home Financials for this Owner
Home Financials are based on the most recent Mortgage that was taken out on this home.
Original Mortgage
$339,300
Outstanding Balance
$216,110
Interest Rate
5.99%
Mortgage Type
Purchase Money Mortgage
Estimated Equity
$547,407
Purchase Details
Closed on
Mar 30, 2001
Sold by
Troup Ernest M
Bought by
Wallace Mark Richard and Wallace Anissa Dawn
Home Financials for this Owner
Home Financials are based on the most recent Mortgage that was taken out on this home.
Original Mortgage
$213,650
Interest Rate
6.92%
Purchase Details
Closed on
Dec 10, 1993
Sold by
John Laing Homes California Inc
Bought by
Troup Ernest M
Home Financials for this Owner
Home Financials are based on the most recent Mortgage that was taken out on this home.
Original Mortgage
$161,504
Interest Rate
7.2%
Mortgage Type
VA
Create a Home Valuation Report for This Property
The Home Valuation Report is an in-depth analysis detailing your home's value as well as a comparison with similar homes in the area
Home Values in the Area
Average Home Value in this Area
Purchase History
| Date | Buyer | Sale Price | Title Company |
|---|---|---|---|
| Park Joanne | $377,000 | Equity Title Orange County-I | |
| Wallace Mark Richard | $225,000 | Equity Title Company | |
| Troup Ernest M | $157,000 | Chicago Title Company |
Source: Public Records
Mortgage History
| Date | Status | Borrower | Loan Amount |
|---|---|---|---|
| Open | Park Joanne | $339,300 | |
| Previous Owner | Wallace Mark Richard | $213,650 | |
| Previous Owner | Troup Ernest M | $161,504 |
Source: Public Records
Tax History Compared to Growth
Tax History
| Year | Tax Paid | Tax Assessment Tax Assessment Total Assessment is a certain percentage of the fair market value that is determined by local assessors to be the total taxable value of land and additions on the property. | Land | Improvement |
|---|---|---|---|---|
| 2025 | $5,017 | $495,188 | $296,680 | $198,508 |
| 2024 | $5,017 | $485,479 | $290,863 | $194,616 |
| 2023 | $4,897 | $475,960 | $285,160 | $190,800 |
| 2022 | $4,809 | $466,628 | $279,569 | $187,059 |
| 2021 | $4,443 | $457,479 | $274,087 | $183,392 |
| 2020 | $4,669 | $452,789 | $271,277 | $181,512 |
| 2019 | $4,575 | $443,911 | $265,958 | $177,953 |
| 2018 | $4,488 | $435,207 | $260,743 | $174,464 |
| 2017 | $4,397 | $426,674 | $255,630 | $171,044 |
| 2016 | $4,630 | $418,308 | $250,617 | $167,691 |
| 2015 | $4,596 | $412,025 | $246,852 | $165,173 |
| 2014 | $4,402 | $367,775 | $216,640 | $151,135 |
Source: Public Records
Map
Nearby Homes
- 16 Santa Barbara Ct
- 22 Santa Barbara Ct Unit 57
- 14 Santa Barbara Ct Unit 61
- 24 Santa Barbara Ct
- 34 Santa Barbara Ct
- 12 Santa Barbara Ct
- 32 Santa Barbara Ct
- 36 Santa Barbara Ct
- 26 Santa Barbara Ct
- 10 Santa Barbara Ct
- 8 Santa Barbara Ct
- 30 Santa Barbara Ct
- 6 Santa Barbara Ct Unit 65
- 38 Santa Barbara Ct
- 2 Santa Barbara Ct Unit 66
- 28 Santa Barbara Ct Unit 54
- 21 Santa Barbara Ct Unit 76
- 42 Santa Barbara Ct Unit 47
- 44 Santa Barbara Ct Unit 46
- 17 Santa Barbara Ct