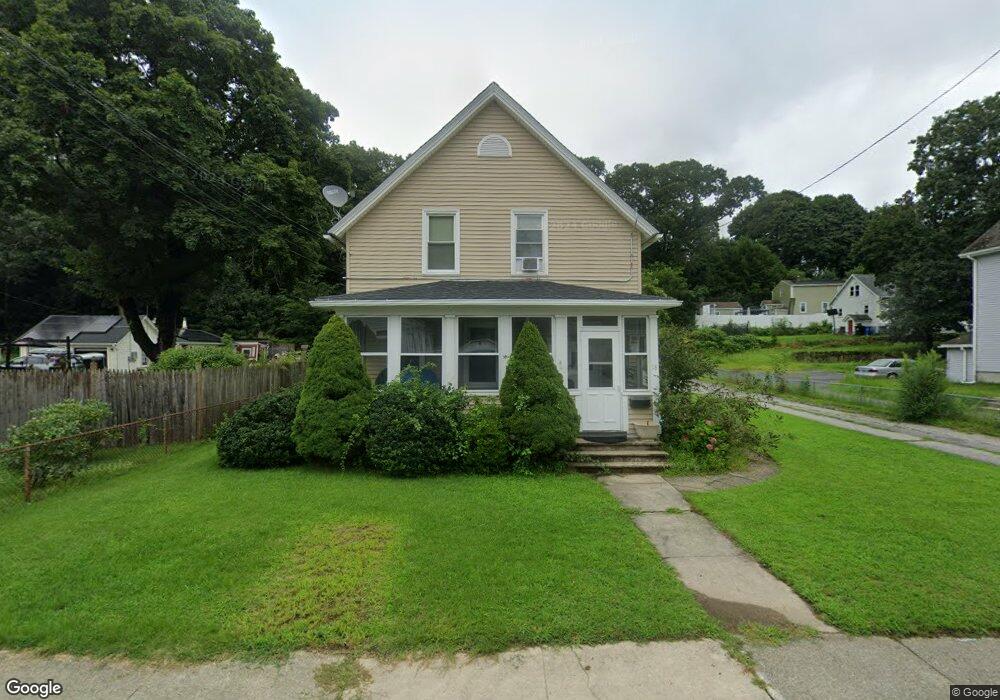
18 School St Danielson, CT 06239
Estimated Value: $292,176 - $335,000
3
Beds
2
Baths
1,302
Sq Ft
$245/Sq Ft
Est. Value
About This Home
This home is located at 18 School St, Danielson, CT 06239 and is currently estimated at $319,044, approximately $245 per square foot. 18 School St is a home located in Windham County with nearby schools including Killingly Central School, Killingly Memorial School, and Killingly Intermediate School.
Ownership History
Date
Name
Owned For
Owner Type
Purchase Details
Closed on
Jun 27, 2002
Sold by
Max Conn Llc
Bought by
Bennett Robert A
Current Estimated Value
Home Financials for this Owner
Home Financials are based on the most recent Mortgage that was taken out on this home.
Original Mortgage
$114,000
Interest Rate
6.92%
Purchase Details
Closed on
Dec 31, 2001
Sold by
Wells Fargo Bk Mn
Bought by
Pappas Charles
Purchase Details
Closed on
May 13, 1999
Sold by
Read Edward W
Bought by
Davio Danny H and Davio Theresa R
Create a Home Valuation Report for This Property
The Home Valuation Report is an in-depth analysis detailing your home's value as well as a comparison with similar homes in the area
Home Values in the Area
Average Home Value in this Area
Purchase History
| Date | Buyer | Sale Price | Title Company |
|---|---|---|---|
| Bennett Robert A | $114,000 | -- | |
| Bennett Robert A | $114,000 | -- | |
| Pappas Charles | $43,500 | -- | |
| Pappas Charles | $43,500 | -- | |
| Davio Danny H | $77,000 | -- | |
| Davio Danny H | $77,000 | -- |
Source: Public Records
Mortgage History
| Date | Status | Borrower | Loan Amount |
|---|---|---|---|
| Open | Davio Danny H | $102,158 | |
| Closed | Davio Danny H | $114,000 |
Source: Public Records
Tax History
| Year | Tax Paid | Tax Assessment Tax Assessment Total Assessment is a certain percentage of the fair market value that is determined by local assessors to be the total taxable value of land and additions on the property. | Land | Improvement |
|---|---|---|---|---|
| 2025 | $3,445 | $137,540 | $20,480 | $117,060 |
| 2024 | $3,289 | $137,540 | $20,480 | $117,060 |
| 2023 | $2,538 | $79,100 | $6,230 | $72,870 |
| 2022 | $2,388 | $79,100 | $6,230 | $72,870 |
| 2021 | $2,388 | $79,100 | $6,230 | $72,870 |
| 2020 | $2,348 | $79,100 | $6,230 | $72,870 |
| 2019 | $2,374 | $79,100 | $6,230 | $72,870 |
| 2017 | $2,021 | $62,650 | $6,230 | $56,420 |
| 2016 | $2,021 | $62,650 | $6,230 | $56,420 |
| 2015 | $1,980 | $62,650 | $6,230 | $56,420 |
| 2014 | $1,933 | $62,650 | $6,230 | $56,420 |
Source: Public Records
Map
Nearby Homes
Your Personal Tour Guide
Ask me questions while you tour the home.