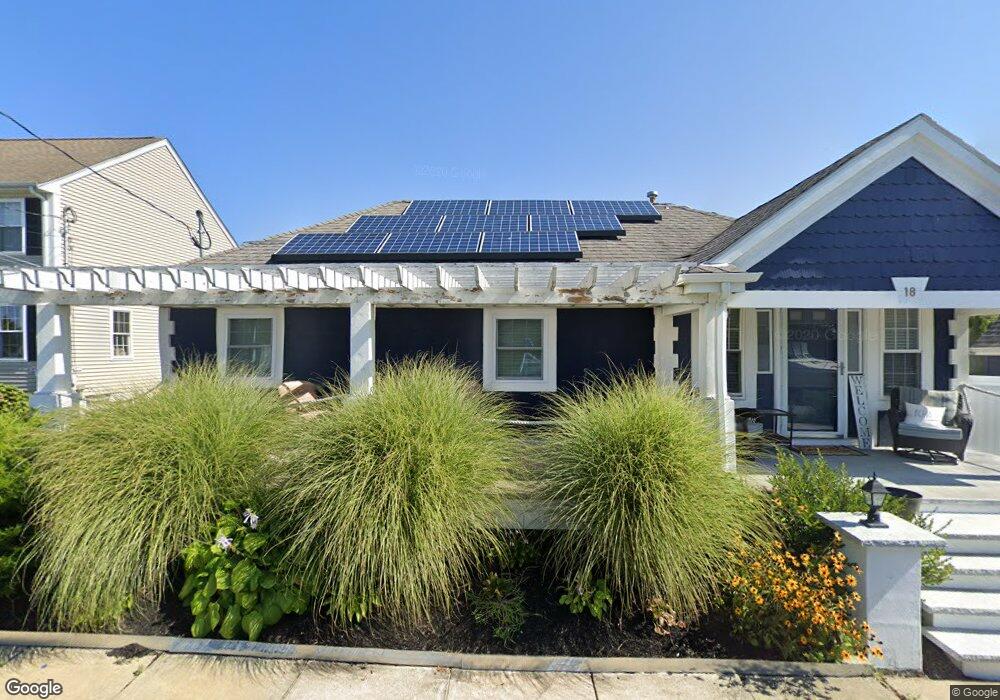
18 Seaview St Fall River, MA 02724
Sandy Beach NeighborhoodEstimated Value: $382,000 - $458,000
2
Beds
1
Bath
1,199
Sq Ft
$350/Sq Ft
Est. Value
About This Home
This home is located at 18 Seaview St, Fall River, MA 02724 and is currently estimated at $419,118, approximately $349 per square foot. 18 Seaview St is a home located in Bristol County with nearby schools including Carlton M. Viveiros Elementary School, Matthew J. Kuss Middle School, and B M C Durfee High School.
Ownership History
Date
Name
Owned For
Owner Type
Purchase Details
Closed on
May 13, 2022
Sold by
Rocha Jason
Bought by
Rocha Dominic J
Current Estimated Value
Home Financials for this Owner
Home Financials are based on the most recent Mortgage that was taken out on this home.
Original Mortgage
$306,000
Outstanding Balance
$288,212
Interest Rate
4.67%
Mortgage Type
Purchase Money Mortgage
Estimated Equity
$130,906
Purchase Details
Closed on
Feb 27, 2002
Sold by
Rocha Jose and Rocha Mary Rose
Bought by
Rocha Jason
Home Financials for this Owner
Home Financials are based on the most recent Mortgage that was taken out on this home.
Original Mortgage
$45,000
Interest Rate
6.84%
Create a Home Valuation Report for This Property
The Home Valuation Report is an in-depth analysis detailing your home's value as well as a comparison with similar homes in the area
Home Values in the Area
Average Home Value in this Area
Purchase History
| Date | Buyer | Sale Price | Title Company |
|---|---|---|---|
| Rocha Dominic J | $340,000 | None Available | |
| Rocha Jason | $100,000 | -- |
Source: Public Records
Mortgage History
| Date | Status | Borrower | Loan Amount |
|---|---|---|---|
| Open | Rocha Dominic J | $306,000 | |
| Previous Owner | Rocha Jason | $75,000 | |
| Previous Owner | Rocha Jason | $128,000 | |
| Previous Owner | Rocha Jason | $45,000 |
Source: Public Records
Tax History
| Year | Tax Paid | Tax Assessment Tax Assessment Total Assessment is a certain percentage of the fair market value that is determined by local assessors to be the total taxable value of land and additions on the property. | Land | Improvement |
|---|---|---|---|---|
| 2025 | $4,146 | $362,100 | $116,700 | $245,400 |
| 2024 | $3,903 | $339,700 | $114,400 | $225,300 |
| 2023 | $3,956 | $322,400 | $103,100 | $219,300 |
| 2022 | $3,506 | $277,800 | $97,200 | $180,600 |
| 2021 | $3,294 | $238,200 | $92,900 | $145,300 |
| 2020 | $3,170 | $219,400 | $88,700 | $130,700 |
| 2019 | $3,139 | $215,300 | $92,700 | $122,600 |
| 2018 | $3,045 | $208,300 | $93,400 | $114,900 |
| 2017 | $2,891 | $206,500 | $93,400 | $113,100 |
| 2016 | $2,748 | $201,600 | $93,500 | $108,100 |
| 2015 | $2,806 | $214,500 | $93,500 | $121,000 |
| 2014 | $2,698 | $214,500 | $93,500 | $121,000 |
Source: Public Records
Map
Nearby Homes
- 391 Clarkson St
- 310 King Philip St
- 616 Woodman St
- 245 Dwelly St
- 126 Wheeler St
- 579 Summit St Unit 3
- 579 Summit St Unit 2
- 2229 S Main St
- 39 Hilton St
- 464 Birch St
- 609 King Philip St
- 644-648 King Philip St
- 15 Higgins St
- 1852 S Main St
- 57 Larouche St
- 1846 S Main St
- 636-644 Dwelly St
- 27 Vista Way
- 76 Church St
- 24 Hall St