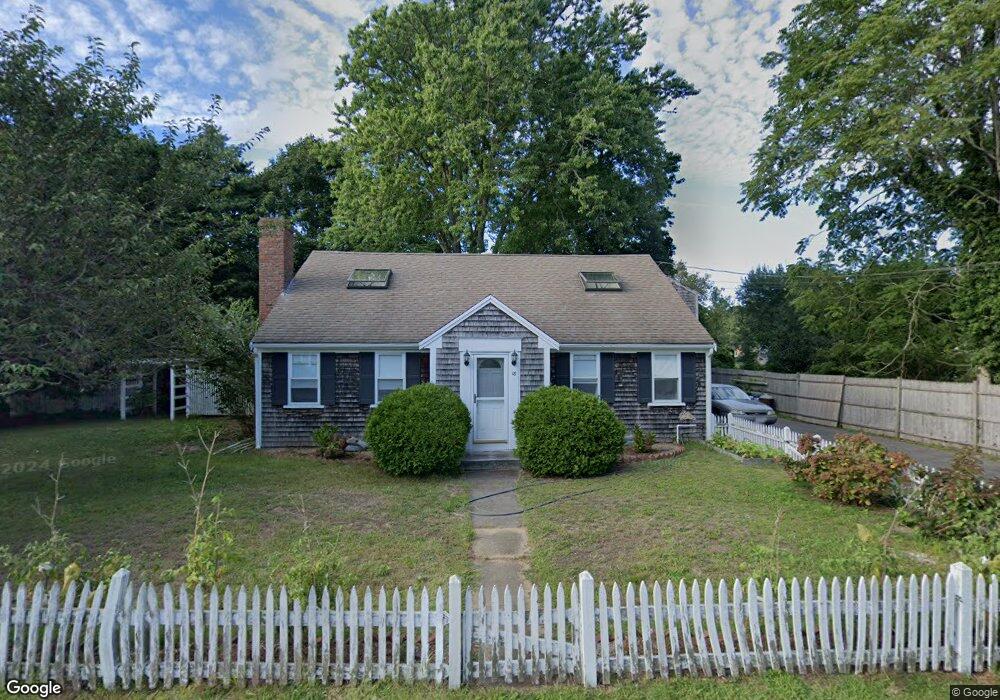
18 Smith St Dennis Port, MA 02639
Dennis Port NeighborhoodEstimated Value: $690,000 - $778,000
3
Beds
2
Baths
1,974
Sq Ft
$368/Sq Ft
Est. Value
About This Home
This home is located at 18 Smith St, Dennis Port, MA 02639 and is currently estimated at $727,145, approximately $368 per square foot. 18 Smith St is a home located in Barnstable County with nearby schools including Dennis-Yarmouth Regional High School and St. Pius X. School.
Ownership History
Date
Name
Owned For
Owner Type
Purchase Details
Closed on
Oct 3, 2011
Sold by
Fnma
Bought by
Brocco Anthony E and Brocco Dawn M
Current Estimated Value
Home Financials for this Owner
Home Financials are based on the most recent Mortgage that was taken out on this home.
Original Mortgage
$221,400
Outstanding Balance
$142,774
Interest Rate
3%
Mortgage Type
Purchase Money Mortgage
Estimated Equity
$584,371
Purchase Details
Closed on
Jul 13, 2011
Sold by
Chalke Dmitri P
Bought by
Federal National Mortgage Association
Create a Home Valuation Report for This Property
The Home Valuation Report is an in-depth analysis detailing your home's value as well as a comparison with similar homes in the area
Home Values in the Area
Average Home Value in this Area
Purchase History
| Date | Buyer | Sale Price | Title Company |
|---|---|---|---|
| Brocco Anthony E | $246,000 | -- | |
| Federal National Mortgage Association | $300,352 | -- |
Source: Public Records
Mortgage History
| Date | Status | Borrower | Loan Amount |
|---|---|---|---|
| Open | Brocco Anthony E | $221,400 |
Source: Public Records
Tax History Compared to Growth
Tax History
| Year | Tax Paid | Tax Assessment Tax Assessment Total Assessment is a certain percentage of the fair market value that is determined by local assessors to be the total taxable value of land and additions on the property. | Land | Improvement |
|---|---|---|---|---|
| 2025 | $3,012 | $695,600 | $129,100 | $566,500 |
| 2024 | $2,960 | $674,300 | $131,500 | $542,800 |
| 2023 | $2,925 | $626,300 | $119,500 | $506,800 |
| 2022 | $2,775 | $495,500 | $119,600 | $375,900 |
| 2021 | $6,822 | $403,300 | $105,500 | $297,800 |
| 2020 | $2,356 | $386,200 | $105,500 | $280,700 |
| 2019 | $2,327 | $353,500 | $103,500 | $250,000 |
| 2018 | $6,254 | $334,400 | $98,500 | $235,900 |
| 2017 | $6,250 | $334,400 | $98,500 | $235,900 |
| 2016 | $2,016 | $308,700 | $109,400 | $199,300 |
| 2015 | $1,976 | $308,700 | $109,400 | $199,300 |
| 2014 | $1,781 | $280,500 | $87,600 | $192,900 |
Source: Public Records
Map
Nearby Homes
- 11 Lane Rd
- 91 Depot Rd W
- 47 Telegraph Rd Unit 1
- 9 Country Ln
- 141 Division St
- 141 Division St
- 24 Indian Trail
- 78 Upper County Rd Unit A&B
- 78 Upper County Rd
- 12 Candlewood Ln Unit 2-9
- 10 Candlewood Ln Unit 2-1
- 9 Bells Neck Rd Unit 10
- 45 Route 28
- 537 Depot St
- 9 Mansion St
- 40 Willow St
- 79 Massachusetts 28
- 64 Smith St
- 73 Division St
- 20 Aunt Debbys Rd