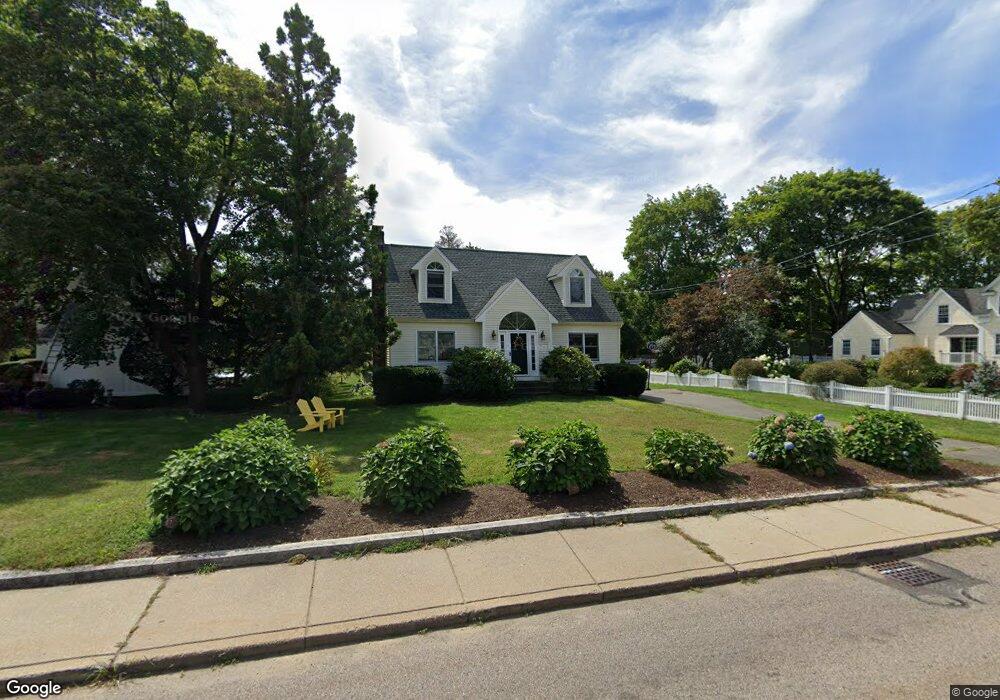
18 Spring St Mansfield, MA 02048
Estimated Value: $626,932 - $712,000
3
Beds
2
Baths
1,639
Sq Ft
$419/Sq Ft
Est. Value
About This Home
This home is located at 18 Spring St, Mansfield, MA 02048 and is currently estimated at $687,233, approximately $419 per square foot. 18 Spring St is a home located in Bristol County with nearby schools including Everett W. Robinson Elementary School, Jordan/Jackson Elementary School, and Harold L. Qualters Middle School.
Ownership History
Date
Name
Owned For
Owner Type
Purchase Details
Closed on
Dec 30, 2011
Sold by
Reitz Andrew L and Brown Rebecca S
Bought by
Stock 3Rd Walter M and Stock Amiee L
Current Estimated Value
Home Financials for this Owner
Home Financials are based on the most recent Mortgage that was taken out on this home.
Original Mortgage
$299,250
Outstanding Balance
$203,862
Interest Rate
4%
Mortgage Type
Purchase Money Mortgage
Estimated Equity
$483,371
Purchase Details
Closed on
Jun 29, 2004
Sold by
Mckenna James M and Mckenna Elaine G
Bought by
Reitz Andrew L and Brown Rebecca S
Home Financials for this Owner
Home Financials are based on the most recent Mortgage that was taken out on this home.
Original Mortgage
$327,900
Interest Rate
6.32%
Mortgage Type
Purchase Money Mortgage
Create a Home Valuation Report for This Property
The Home Valuation Report is an in-depth analysis detailing your home's value as well as a comparison with similar homes in the area
Home Values in the Area
Average Home Value in this Area
Purchase History
| Date | Buyer | Sale Price | Title Company |
|---|---|---|---|
| Stock 3Rd Walter M | $315,000 | -- | |
| Reitz Andrew L | $409,900 | -- |
Source: Public Records
Mortgage History
| Date | Status | Borrower | Loan Amount |
|---|---|---|---|
| Open | Stock 3Rd Walter M | $299,250 | |
| Previous Owner | Reitz Andrew L | $327,900 |
Source: Public Records
Tax History
| Year | Tax Paid | Tax Assessment Tax Assessment Total Assessment is a certain percentage of the fair market value that is determined by local assessors to be the total taxable value of land and additions on the property. | Land | Improvement |
|---|---|---|---|---|
| 2025 | $6,891 | $523,200 | $229,200 | $294,000 |
| 2024 | $7,092 | $525,300 | $229,200 | $296,100 |
| 2023 | $7,000 | $496,800 | $229,200 | $267,600 |
| 2022 | $6,735 | $444,000 | $212,200 | $231,800 |
| 2021 | $4,285 | $428,600 | $185,600 | $243,000 |
| 2020 | $6,162 | $401,200 | $176,800 | $224,400 |
| 2019 | $3,891 | $373,900 | $147,400 | $226,500 |
| 2018 | $3,621 | $360,800 | $140,500 | $220,300 |
| 2017 | $5,048 | $336,100 | $136,400 | $199,700 |
| 2016 | $4,888 | $317,200 | $129,900 | $187,300 |
| 2015 | $4,852 | $313,000 | $129,900 | $183,100 |
Source: Public Records
Map
Nearby Homes
- 44 Fairfield Park Unit 44
- 28 Court St
- 46 Hope St
- 150 Rumford Ave Unit 110
- 266 N Main St Unit 3
- 1 Deer Path Ln
- 22 Pleasant St Unit C
- 152 Central St
- 81 Chilson Ave
- 166 Chauncy St
- 460 Ware St
- 73-75 Draper Ave
- 571 Ware St
- 14 Windchime Dr
- 619 N Main St
- 4 Concetta Cir
- 19 Barberry Rd
- 356 Central St
- 212 Mill St
- 4 Erick Rd Unit 90
Your Personal Tour Guide
Ask me questions while you tour the home.