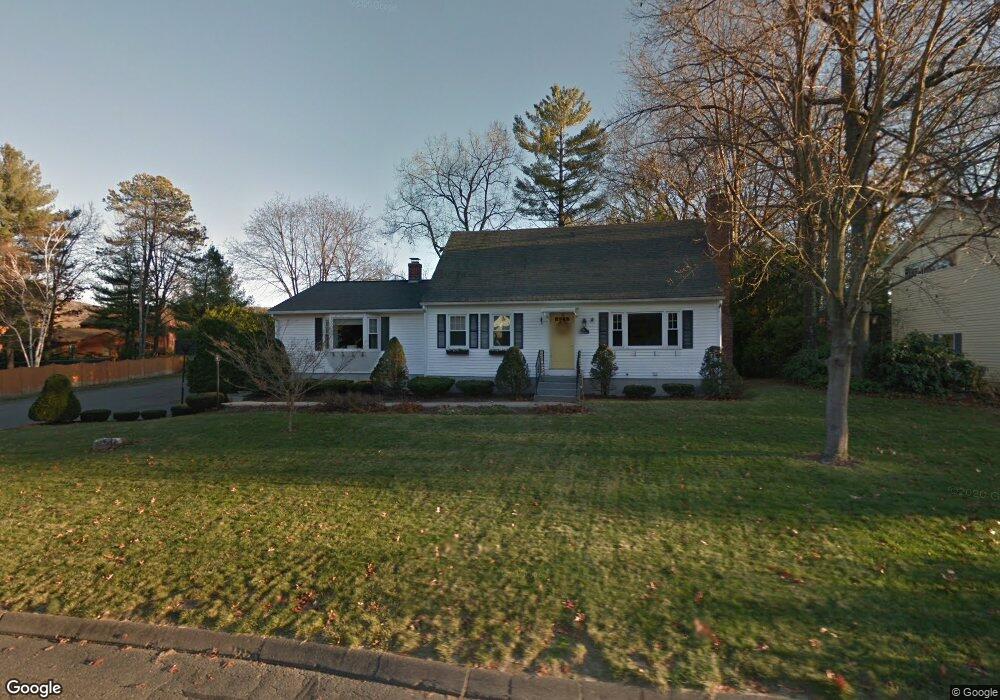
18 Sterling Dr Easthampton, MA 01027
Estimated Value: $575,594 - $600,000
4
Beds
2
Baths
2,133
Sq Ft
$275/Sq Ft
Est. Value
About This Home
This home is located at 18 Sterling Dr, Easthampton, MA 01027 and is currently estimated at $586,899, approximately $275 per square foot. 18 Sterling Dr is a home located in Hampshire County with nearby schools including Easthampton High School, Calvary Baptist Christian School, and New England Adolescent Research Institute.
Ownership History
Date
Name
Owned For
Owner Type
Purchase Details
Closed on
Apr 11, 2008
Sold by
Lucey Abbey A and Skowronek Michael J
Bought by
Lucey Abbey A
Current Estimated Value
Home Financials for this Owner
Home Financials are based on the most recent Mortgage that was taken out on this home.
Original Mortgage
$155,000
Interest Rate
6.3%
Mortgage Type
Purchase Money Mortgage
Purchase Details
Closed on
Oct 31, 2003
Sold by
Cynthia L Donahue Fund and Donahue Cynthia L
Bought by
Skowronek Michael J and Lucey Abbey A
Home Financials for this Owner
Home Financials are based on the most recent Mortgage that was taken out on this home.
Original Mortgage
$150,000
Interest Rate
6.05%
Mortgage Type
Purchase Money Mortgage
Create a Home Valuation Report for This Property
The Home Valuation Report is an in-depth analysis detailing your home's value as well as a comparison with similar homes in the area
Home Values in the Area
Average Home Value in this Area
Purchase History
| Date | Buyer | Sale Price | Title Company |
|---|---|---|---|
| Lucey Abbey A | -- | -- | |
| Skowronek Michael J | $263,500 | -- |
Source: Public Records
Mortgage History
| Date | Status | Borrower | Loan Amount |
|---|---|---|---|
| Open | Skowronek Michael J | $176,000 | |
| Closed | Lucey Abbey A | $155,000 | |
| Previous Owner | Skowronek Michael J | $150,000 | |
| Previous Owner | Skowronek Michael J | $100,000 |
Source: Public Records
Tax History
| Year | Tax Paid | Tax Assessment Tax Assessment Total Assessment is a certain percentage of the fair market value that is determined by local assessors to be the total taxable value of land and additions on the property. | Land | Improvement |
|---|---|---|---|---|
| 2025 | $7,089 | $518,600 | $120,700 | $397,900 |
| 2024 | $6,806 | $501,900 | $117,200 | $384,700 |
| 2023 | $5,040 | $344,000 | $92,200 | $251,800 |
| 2022 | $5,686 | $344,000 | $92,200 | $251,800 |
| 2021 | $6,297 | $359,000 | $92,200 | $266,800 |
| 2020 | $6,109 | $344,000 | $92,200 | $251,800 |
| 2019 | $5,085 | $328,900 | $92,200 | $236,700 |
| 2018 | $4,898 | $306,100 | $86,900 | $219,200 |
| 2017 | $4,785 | $295,200 | $83,500 | $211,700 |
| 2016 | $4,641 | $297,700 | $83,500 | $214,200 |
| 2015 | $4,510 | $297,700 | $83,500 | $214,200 |
Source: Public Records
Map
Nearby Homes
Your Personal Tour Guide
Ask me questions while you tour the home.