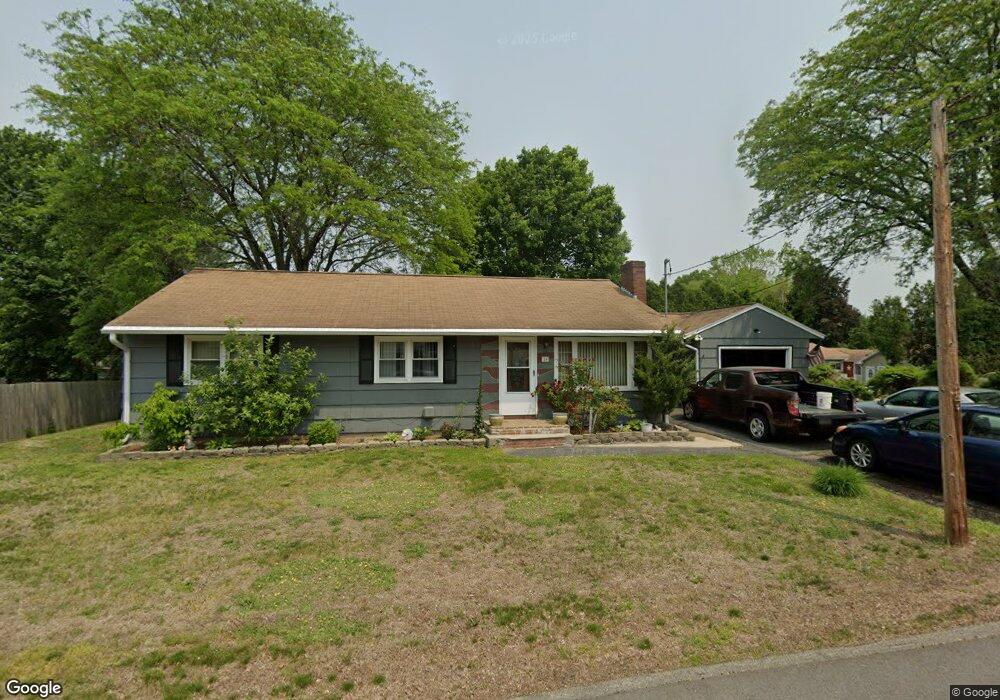
18 Swan St Nashua, NH 03060
South End Nashua NeighborhoodEstimated Value: $454,000 - $511,000
3
Beds
1
Bath
1,260
Sq Ft
$390/Sq Ft
Est. Value
About This Home
This home is located at 18 Swan St, Nashua, NH 03060 and is currently estimated at $491,667, approximately $390 per square foot. 18 Swan St is a home located in Hillsborough County with nearby schools including Fairgrounds Elementary School, Fairgrounds Middle School, and Nashua High School South.
Ownership History
Date
Name
Owned For
Owner Type
Purchase Details
Closed on
Feb 15, 2005
Sold by
Broadhurst Sandra
Bought by
Oliveira Antonio M and Oliveira Lucia M
Current Estimated Value
Home Financials for this Owner
Home Financials are based on the most recent Mortgage that was taken out on this home.
Original Mortgage
$100,000
Interest Rate
5.83%
Mortgage Type
Purchase Money Mortgage
Create a Home Valuation Report for This Property
The Home Valuation Report is an in-depth analysis detailing your home's value as well as a comparison with similar homes in the area
Home Values in the Area
Average Home Value in this Area
Purchase History
| Date | Buyer | Sale Price | Title Company |
|---|---|---|---|
| Oliveira Antonio M | $270,000 | -- |
Source: Public Records
Mortgage History
| Date | Status | Borrower | Loan Amount |
|---|---|---|---|
| Open | Oliveira Antonio M | $110,000 | |
| Closed | Oliveira Antonio M | $100,000 |
Source: Public Records
Tax History Compared to Growth
Tax History
| Year | Tax Paid | Tax Assessment Tax Assessment Total Assessment is a certain percentage of the fair market value that is determined by local assessors to be the total taxable value of land and additions on the property. | Land | Improvement |
|---|---|---|---|---|
| 2024 | $7,252 | $456,100 | $157,100 | $299,000 |
| 2023 | $6,904 | $378,700 | $125,600 | $253,100 |
| 2022 | $6,843 | $378,700 | $125,600 | $253,100 |
| 2021 | $5,903 | $254,200 | $83,800 | $170,400 |
| 2020 | $5,747 | $254,200 | $83,800 | $170,400 |
| 2019 | $5,531 | $254,200 | $83,800 | $170,400 |
| 2018 | $5,392 | $254,200 | $83,800 | $170,400 |
| 2017 | $4,668 | $181,000 | $72,600 | $108,400 |
| 2016 | $4,538 | $181,000 | $72,600 | $108,400 |
| 2015 | $4,440 | $181,000 | $72,600 | $108,400 |
| 2014 | $4,353 | $181,000 | $72,600 | $108,400 |
Source: Public Records
Map
Nearby Homes
- 11 Bordeaux St
- 22 Kern Dr
- 41 New Dunstable Rd Unit 371
- 22 New Dunstable Rd Unit 132133
- 247 Main Dunstable Rd
- 97 Linwood St
- 169A W Hollis St Unit 193
- 4 Henry David Dr Unit 203
- 8 Althea Ln Unit U26
- 63 Dexter St
- 30 Gendron St
- 29 Greenwood Dr
- 4 Badger St
- 23 Glen Dr
- 22 Wilder St
- 121 Palm St
- 30 Ledge St
- 47 Dogwood Dr Unit U202
- 599 W Hollis St
- 15 Lovell St Unit 20
- 8 Chapman St Unit 3033
- 26 Lund Rd Unit 3940
- 17 Swan St
- 15 Swan St
- 6 Cote Ave Unit 27
- 9 Swan St Unit 11
- 24 Lund Rd
- 2 Chapman St Unit 26
- 11 Chapman St
- 40 Lund Rd
- 29 Lund Rd
- 17 Chapman St
- 6 Bordeaux St
- 7 Swan St Unit 50
- 4 Cote Ave Unit 23
- 10 Bourdeaux St
- 6 Bourdeaux St Unit 64
- 6 Chapman St
- 21 Ferson St
- 10 Bordeaux St