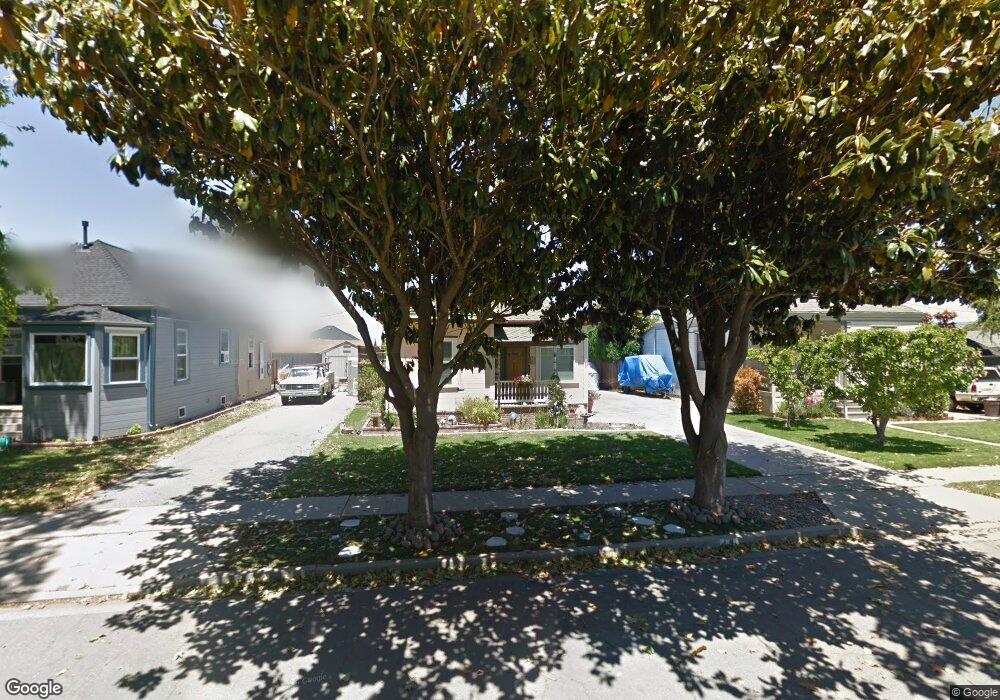
18 Third St Spreckels, CA 93962
Estimated Value: $593,179 - $730,000
2
Beds
1
Bath
979
Sq Ft
$670/Sq Ft
Est. Value
About This Home
This home is located at 18 Third St, Spreckels, CA 93962 and is currently estimated at $655,795, approximately $669 per square foot. 18 Third St is a home with nearby schools including Spreckels Elementary School, Buena Vista Middle School, and Salinas High School.
Ownership History
Date
Name
Owned For
Owner Type
Purchase Details
Closed on
Aug 19, 2003
Sold by
Jorgensen Shaheen and Deangelo Shaheen
Bought by
Jorgensen Ricky and Jorgensen Shaheen
Current Estimated Value
Purchase Details
Closed on
Aug 28, 2000
Sold by
Wells Sally Jane and Klapheck Patricia Ann Miljarak
Bought by
Deangelo Shaheen
Home Financials for this Owner
Home Financials are based on the most recent Mortgage that was taken out on this home.
Original Mortgage
$168,000
Outstanding Balance
$61,664
Interest Rate
8.2%
Mortgage Type
Seller Take Back
Estimated Equity
$594,131
Create a Home Valuation Report for This Property
The Home Valuation Report is an in-depth analysis detailing your home's value as well as a comparison with similar homes in the area
Home Values in the Area
Average Home Value in this Area
Purchase History
| Date | Buyer | Sale Price | Title Company |
|---|---|---|---|
| Jorgensen Ricky | -- | Stewart Title | |
| Deangelo Shaheen | $180,000 | Fidelity National Title Co |
Source: Public Records
Mortgage History
| Date | Status | Borrower | Loan Amount |
|---|---|---|---|
| Open | Deangelo Shaheen | $168,000 |
Source: Public Records
Tax History
| Year | Tax Paid | Tax Assessment Tax Assessment Total Assessment is a certain percentage of the fair market value that is determined by local assessors to be the total taxable value of land and additions on the property. | Land | Improvement |
|---|---|---|---|---|
| 2025 | $3,266 | $271,204 | $135,602 | $135,602 |
| 2024 | $3,266 | $265,888 | $132,944 | $132,944 |
| 2023 | $3,154 | $260,676 | $130,338 | $130,338 |
| 2022 | $2,964 | $255,566 | $127,783 | $127,783 |
| 2021 | $2,838 | $250,556 | $125,278 | $125,278 |
| 2020 | $2,774 | $247,988 | $123,994 | $123,994 |
| 2019 | $2,756 | $243,126 | $121,563 | $121,563 |
| 2018 | $2,719 | $238,360 | $119,180 | $119,180 |
| 2017 | $2,776 | $233,688 | $116,844 | $116,844 |
| 2016 | $2,679 | $229,106 | $114,553 | $114,553 |
| 2015 | -- | $225,666 | $112,833 | $112,833 |
| 2014 | -- | $221,246 | $110,623 | $110,623 |
Source: Public Records
Map
Nearby Homes
- 89 Hatton Ave
- 17669 River Run Rd
- 18050 Stonehaven
- 18595 Ranchito Del Rio Dr
- 26419 Honor Ln
- 0000 Woodridge Ct
- 22125 Ranchito Dr
- 27312 Bavella Way
- 1211 Via Paraiso
- 207 Encinada Dr
- 1115 San Angelo Dr
- 323 San Miguel Ave
- 646 Santa Cruz Ave
- 19311 Creekside Cir Unit 36
- 612 Alameda Ave
- 19223 Creekside Ln
- 14 San Juan Dr
- 15 Del Rey Cir
- 141 Del Mar Dr
- 333 Hawthorne St
Your Personal Tour Guide
Ask me questions while you tour the home.