Estimated Value: $321,208 - $347,000
3
Beds
2
Baths
2,290
Sq Ft
$145/Sq Ft
Est. Value
About This Home
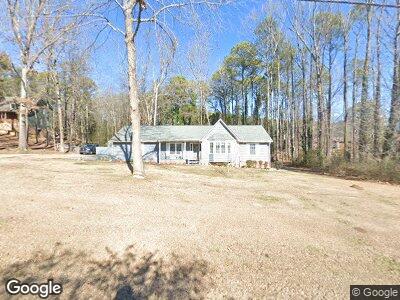
This home is located at 18 Twickenham Rd SE, Rome, GA 30161 and is currently estimated at $331,052, approximately $144 per square foot. 18 Twickenham Rd SE is a home located in Floyd County with nearby schools including Pepperell Middle School, Pepperell High School, and Montessori School of Rome.
Ownership History
Date
Name
Owned For
Owner Type
Purchase Details
Closed on
Aug 1, 2024
Sold by
Carter William Lee
Bought by
Carter Mary Burnett
Current Estimated Value
Purchase Details
Closed on
Aug 21, 2019
Sold by
Carter Mary B
Bought by
Carter Mary B and Carter William Lee
Home Financials for this Owner
Home Financials are based on the most recent Mortgage that was taken out on this home.
Original Mortgage
$45,000
Interest Rate
3.7%
Mortgage Type
New Conventional
Purchase Details
Closed on
Jun 30, 2004
Sold by
Anderson Marilyn Siegel and Solomon Siegel
Bought by
Tarrant Fredrick and Tarran Melissa P
Purchase Details
Closed on
Jun 20, 1997
Sold by
Hawley Harold P and Hawley Lucrecia T
Bought by
Anderson Marilyn Siegel and Anderson Solomon S
Purchase Details
Closed on
Oct 15, 1992
Sold by
Mcauliff Lawrence
Bought by
Hawley Harold P and Hawley Lucrecia T
Purchase Details
Closed on
Jan 26, 1990
Sold by
Lynes Gerald W and Sara Kay
Bought by
Mcauliff Lawrence
Purchase Details
Closed on
Jul 23, 1985
Bought by
Lynes Gerald W and Sara Kay
Create a Home Valuation Report for This Property
The Home Valuation Report is an in-depth analysis detailing your home's value as well as a comparison with similar homes in the area
Home Values in the Area
Average Home Value in this Area
Purchase History
| Date | Buyer | Sale Price | Title Company |
|---|---|---|---|
| Carter Mary Burnett | -- | -- | |
| Carter Mary B | -- | -- | |
| Carter Mary B | $179,000 | -- | |
| Tarrant Fredrick | $145,000 | -- | |
| Anderson Marilyn Siegel | $100,000 | -- | |
| Hawley Harold P | $89,000 | -- | |
| Mcauliff Lawrence | $81,900 | -- | |
| Lynes Gerald W | $68,000 | -- |
Source: Public Records
Mortgage History
| Date | Status | Borrower | Loan Amount |
|---|---|---|---|
| Previous Owner | Carter Mary B | $45,000 |
Source: Public Records
Tax History Compared to Growth
Tax History
| Year | Tax Paid | Tax Assessment Tax Assessment Total Assessment is a certain percentage of the fair market value that is determined by local assessors to be the total taxable value of land and additions on the property. | Land | Improvement |
|---|---|---|---|---|
| 2024 | $3,157 | $123,772 | $13,614 | $110,158 |
| 2023 | $3,157 | $113,903 | $12,101 | $101,802 |
| 2022 | $2,740 | $93,792 | $9,832 | $83,960 |
| 2021 | $2,610 | $84,527 | $9,076 | $75,451 |
| 2020 | $2,198 | $74,179 | $7,185 | $66,994 |
| 2019 | $1,920 | $63,999 | $7,185 | $56,814 |
| 2018 | $1,855 | $60,546 | $7,185 | $53,361 |
| 2017 | $1,752 | $56,887 | $7,185 | $49,702 |
| 2016 | $1,743 | $55,880 | $7,160 | $48,720 |
| 2015 | $1,751 | $57,202 | $7,160 | $50,042 |
| 2014 | $1,751 | $57,202 | $7,160 | $50,042 |
Source: Public Records
Map
Nearby Homes
- 168 Wellington Way SE
- 40 Wellington Way SE
- 36 Coventry Dr SE
- 11 Cambridge Dr SE
- 0 Wellington Way SE Unit 7374604
- 0 Wellington Way SE Unit 7374602
- 0 Wellington Way SE Unit 20180069
- 0 Wellington Way SE Unit 20180068
- 85 Cambridge Dr SE
- 102 Margo Trail SE
- 313 Chateau Dr SE
- 22 Coventry Dr SE
- 20 Coventry Dr SE
- 211 Chateau Dr SE
- 2 Saddlebrook Dr SE
- 0 Warwick Way SE Unit 20129016
- 23 Saddlebrook Dr SE
- 31 Saddlebrook Dr SE
- 30 Saddlebrook Dr SE
- 35 Saddle Mountain Rd SE
- 18 Twickenham Rd SE
- 20 Twickenham Rd SE
- 9 Wellington Way SE
- 19 Twickenham Rd SE
- 21 Twickenham Rd SE
- 5 Wellington Way SE
- 11 Wellington Way SE
- 3 Wellington Way SE
- 22 Twickenham Rd SE
- 10 Twin Ct SE
- 13 Wellington Way SE
- 24 Twickenham Rd SE
- 23 Twickenham Rd SE
- 9 Old Twickenham Rd SE
- 2 Margo Trail SE
- 15 Wellington Way SE
- 6 Margo Trail SE
- 2 Wellington Way SE
- 4 Wellington Way SE
- 00 Margo Trail SE