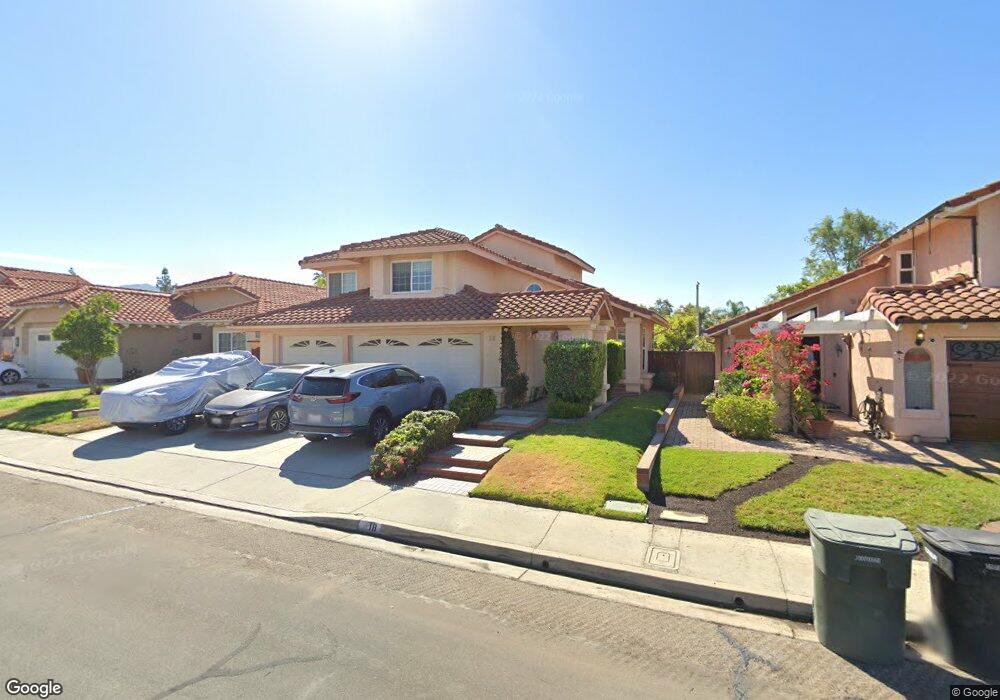
18 Via de la Mesa Rancho Santa Margarita, CA 92688
Estimated Value: $1,152,000 - $1,305,000
3
Beds
3
Baths
1,890
Sq Ft
$638/Sq Ft
Est. Value
About This Home
This home is located at 18 Via de la Mesa, Rancho Santa Margarita, CA 92688 and is currently estimated at $1,206,471, approximately $638 per square foot. 18 Via de la Mesa is a home located in Orange County with nearby schools including Trabuco Mesa Elementary School, Rancho Santa Margarita Intermediate School, and Trabuco Hills High School.
Ownership History
Date
Name
Owned For
Owner Type
Purchase Details
Closed on
Apr 5, 2001
Sold by
Holderman Bridget and Schomburg Bridget A Love
Bought by
Holderman Kai and Holderman Bridget
Current Estimated Value
Home Financials for this Owner
Home Financials are based on the most recent Mortgage that was taken out on this home.
Original Mortgage
$203,000
Outstanding Balance
$74,889
Interest Rate
7.03%
Estimated Equity
$1,131,582
Purchase Details
Closed on
Nov 5, 1997
Sold by
Schomburg Thomas H and Love Schomburg Bridget A
Bought by
Schomburg Bridget A Love
Purchase Details
Closed on
Mar 5, 1997
Sold by
Hagan Richard S and Hagan Terry D
Bought by
Schomburg Thomas H and Love Shomburg Bridget A
Home Financials for this Owner
Home Financials are based on the most recent Mortgage that was taken out on this home.
Original Mortgage
$201,850
Interest Rate
7.5%
Purchase Details
Closed on
Feb 19, 1993
Sold by
Hagan Richard S and Hagan Terry D
Bought by
Hagan Richard S and Hagan Terry D
Create a Home Valuation Report for This Property
The Home Valuation Report is an in-depth analysis detailing your home's value as well as a comparison with similar homes in the area
Home Values in the Area
Average Home Value in this Area
Purchase History
| Date | Buyer | Sale Price | Title Company |
|---|---|---|---|
| Holderman Kai | -- | Stewart Title | |
| Schomburg Bridget A Love | -- | -- | |
| Schomburg Thomas H | $212,500 | Orange Coast Title | |
| Hagan Richard S | -- | -- |
Source: Public Records
Mortgage History
| Date | Status | Borrower | Loan Amount |
|---|---|---|---|
| Open | Holderman Kai | $203,000 | |
| Closed | Schomburg Thomas H | $201,850 |
Source: Public Records
Tax History Compared to Growth
Tax History
| Year | Tax Paid | Tax Assessment Tax Assessment Total Assessment is a certain percentage of the fair market value that is determined by local assessors to be the total taxable value of land and additions on the property. | Land | Improvement |
|---|---|---|---|---|
| 2025 | $3,461 | $346,083 | $117,631 | $228,452 |
| 2024 | $3,461 | $339,298 | $115,325 | $223,973 |
| 2023 | $3,380 | $332,646 | $113,064 | $219,582 |
| 2022 | $3,320 | $326,124 | $110,847 | $215,277 |
| 2021 | $2,353 | $319,730 | $108,674 | $211,056 |
| 2020 | $3,227 | $316,452 | $107,560 | $208,892 |
| 2019 | $3,379 | $310,248 | $105,451 | $204,797 |
| 2018 | $3,322 | $304,165 | $103,383 | $200,782 |
| 2017 | $3,312 | $298,201 | $101,355 | $196,846 |
| 2016 | $3,877 | $292,354 | $99,367 | $192,987 |
| 2015 | $4,038 | $287,963 | $97,874 | $190,089 |
| 2014 | $3,977 | $282,323 | $95,957 | $186,366 |
Source: Public Records
Map
Nearby Homes
- 34 Dianthus
- 21 Lobelia
- 3 Vista Mesa Unit 44
- 27 Calle Melinda
- 19 Vista Barranca Unit 75
- 31 Brisa Del Lago
- 1 Brisa Del Lago
- 23 Vista Colinas
- 7 Via Tortuga
- 36 Calle Maria
- 231 Montana Del Lago Dr Unit 22
- 250 Montana Del Lago Dr
- 25 Dewberry
- 28 Montana Del Lago Dr Unit 159
- 26 Montana Del Lago Dr
- 7 Santolina
- 16 Las Piedras
- 73 Gaviota
- 12 Azalea Unit 104
- 31 Gaviota Unit 136
- 16 Via de la Mesa
- 20 Via de la Mesa
- 14 Via de la Mesa
- 22 Via de la Mesa
- 12 Via de la Mesa
- 24 Via de la Mesa
- 17 Via de la Mesa
- 15 Via de la Mesa
- 19 Via de la Mesa
- 13 Via de la Mesa
- 21 Via de la Mesa
- 10 Via de la Mesa
- 11 Via de la Mesa
- 21 Floramar Unit 2
- 23 Floramar Unit 3
- 15 Floramar
- 13 Floramar Unit 61
- 26 Via de la Mesa
- 25 Floramar Unit 4
- 11 Floramar Unit 62