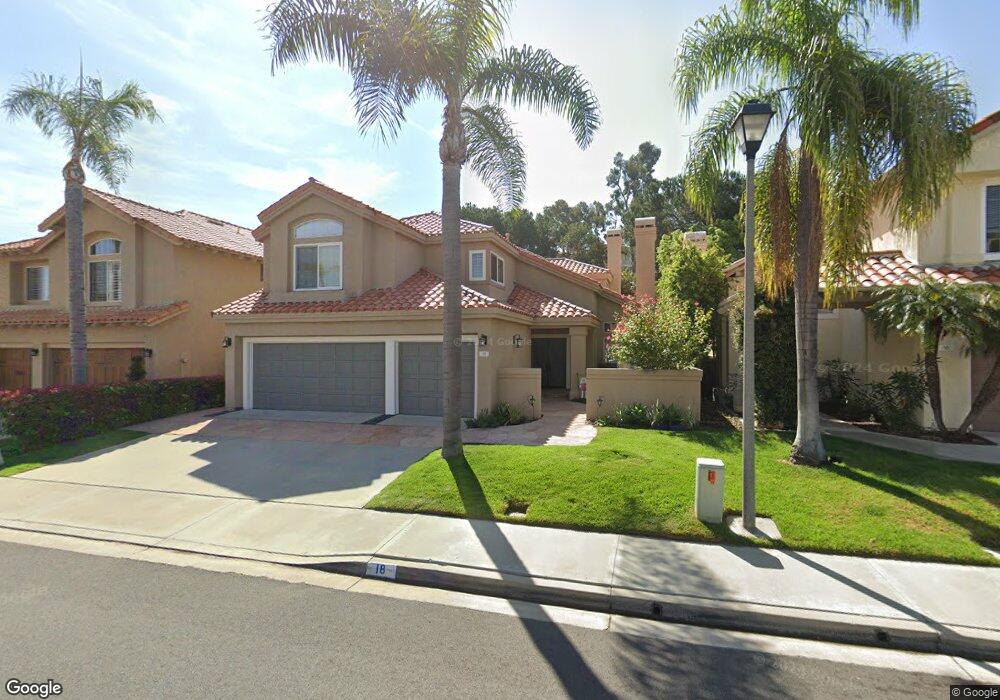
18 Via di Nola Laguna Niguel, CA 92677
Marina Hills NeighborhoodEstimated Value: $2,021,109 - $2,312,000
4
Beds
3
Baths
2,883
Sq Ft
$774/Sq Ft
Est. Value
About This Home
This home is located at 18 Via di Nola, Laguna Niguel, CA 92677 and is currently estimated at $2,231,777, approximately $774 per square foot. 18 Via di Nola is a home located in Orange County with nearby schools including George White Elementary, Niguel Hills Middle School, and Dana Hills High School.
Ownership History
Date
Name
Owned For
Owner Type
Purchase Details
Closed on
Jan 3, 2025
Sold by
Ferguson James D and Ferguson Josienne M
Bought by
James & Josienne Ferguson Family Trust and Ferguson
Current Estimated Value
Purchase Details
Closed on
Apr 24, 2002
Sold by
Parker Robert and Parker Mary Kay
Bought by
Ferguson James D and Ferguson Josienne M
Home Financials for this Owner
Home Financials are based on the most recent Mortgage that was taken out on this home.
Original Mortgage
$458,500
Interest Rate
7.13%
Purchase Details
Closed on
May 17, 1999
Sold by
Robert Parker and Robert Mary K
Bought by
Parker Robert and Parker Mary Kay
Home Financials for this Owner
Home Financials are based on the most recent Mortgage that was taken out on this home.
Original Mortgage
$360,000
Interest Rate
7.25%
Create a Home Valuation Report for This Property
The Home Valuation Report is an in-depth analysis detailing your home's value as well as a comparison with similar homes in the area
Home Values in the Area
Average Home Value in this Area
Purchase History
| Date | Buyer | Sale Price | Title Company |
|---|---|---|---|
| James & Josienne Ferguson Family Trust | -- | None Listed On Document | |
| Ferguson James D | $655,000 | American Title Co | |
| Parker Robert | -- | United Title Company |
Source: Public Records
Mortgage History
| Date | Status | Borrower | Loan Amount |
|---|---|---|---|
| Previous Owner | Ferguson James D | $458,500 | |
| Previous Owner | Parker Robert | $360,000 |
Source: Public Records
Tax History Compared to Growth
Tax History
| Year | Tax Paid | Tax Assessment Tax Assessment Total Assessment is a certain percentage of the fair market value that is determined by local assessors to be the total taxable value of land and additions on the property. | Land | Improvement |
|---|---|---|---|---|
| 2025 | $9,545 | $967,626 | $582,146 | $385,480 |
| 2024 | $9,545 | $948,653 | $570,731 | $377,922 |
| 2023 | $9,342 | $930,052 | $559,540 | $370,512 |
| 2022 | $9,163 | $911,816 | $548,568 | $363,248 |
| 2021 | $8,985 | $893,938 | $537,812 | $356,126 |
| 2020 | $8,895 | $884,772 | $532,297 | $352,475 |
| 2019 | $8,718 | $867,424 | $521,860 | $345,564 |
| 2018 | $8,549 | $850,416 | $511,627 | $338,789 |
| 2017 | $8,381 | $833,742 | $501,595 | $332,147 |
| 2016 | $8,219 | $817,395 | $491,760 | $325,635 |
| 2015 | $8,095 | $805,117 | $484,373 | $320,744 |
| 2014 | $7,938 | $789,346 | $474,884 | $314,462 |
Source: Public Records
Map
Nearby Homes