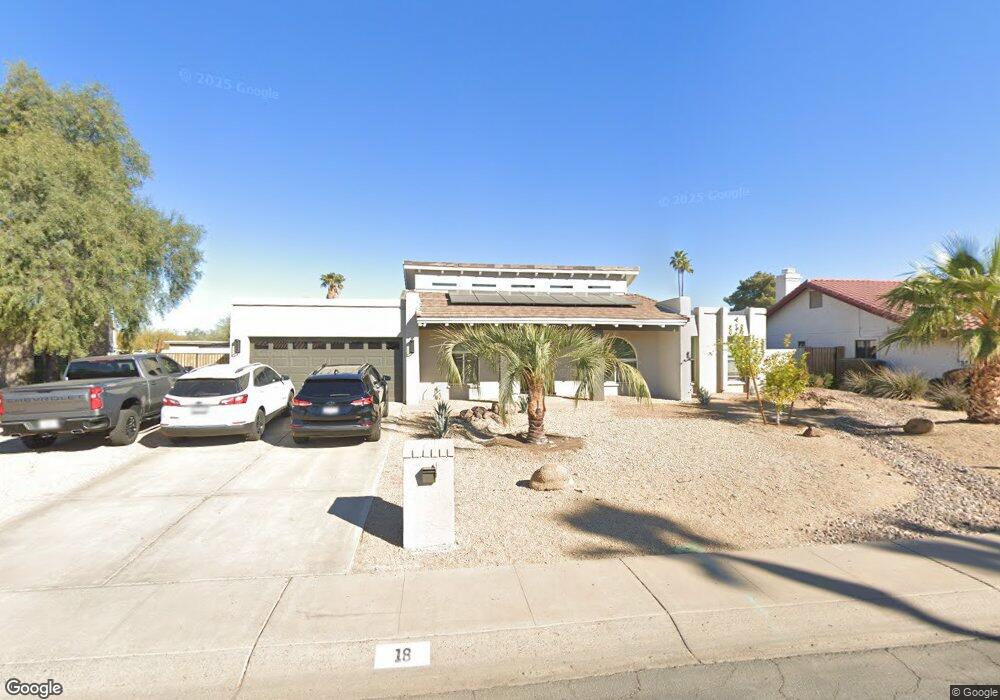
18 W Monte Cristo Ave Phoenix, AZ 85023
Moon Valley NeighborhoodEstimated Value: $605,100 - $748,000
--
Bed
3
Baths
2,018
Sq Ft
$347/Sq Ft
Est. Value
About This Home
This home is located at 18 W Monte Cristo Ave, Phoenix, AZ 85023 and is currently estimated at $699,275, approximately $346 per square foot. 18 W Monte Cristo Ave is a home located in Maricopa County with nearby schools including Lookout Mountain School, Mountain Sky Jr. High School, and Thunderbird High School.
Ownership History
Date
Name
Owned For
Owner Type
Purchase Details
Closed on
Nov 1, 2016
Sold by
Wolf Steven
Bought by
Farrell Twyla and Farrell Ryan
Current Estimated Value
Home Financials for this Owner
Home Financials are based on the most recent Mortgage that was taken out on this home.
Original Mortgage
$356,250
Outstanding Balance
$286,007
Interest Rate
3.42%
Mortgage Type
New Conventional
Estimated Equity
$413,268
Purchase Details
Closed on
May 13, 2016
Sold by
Wolf Jamie
Bought by
Wolf Steven
Purchase Details
Closed on
May 26, 1999
Sold by
Cerf Carolyn R
Bought by
Cerf Carolyn R and Carolyn Cerf Trust
Home Financials for this Owner
Home Financials are based on the most recent Mortgage that was taken out on this home.
Original Mortgage
$95,000
Interest Rate
6.84%
Purchase Details
Closed on
Nov 11, 1997
Sold by
Cerf Carolyn R
Bought by
Cerf Carolyn R and Carolyn Cerf Trust
Create a Home Valuation Report for This Property
The Home Valuation Report is an in-depth analysis detailing your home's value as well as a comparison with similar homes in the area
Home Values in the Area
Average Home Value in this Area
Purchase History
| Date | Buyer | Sale Price | Title Company |
|---|---|---|---|
| Farrell Twyla | $375,000 | Magnus Title Agency | |
| Wolf Steven | -- | Magnus Title Agency | |
| Wolf Steven | $225,000 | Magnus Title Agency | |
| Cerf Carolyn R | -- | Transnation Title Ins Co | |
| Cerf Carolyn R | -- | Transnation Title Ins Co | |
| Cerf Carolyn R | -- | -- |
Source: Public Records
Mortgage History
| Date | Status | Borrower | Loan Amount |
|---|---|---|---|
| Open | Farrell Twyla | $356,250 | |
| Previous Owner | Cerf Carolyn R | $95,000 |
Source: Public Records
Tax History Compared to Growth
Tax History
| Year | Tax Paid | Tax Assessment Tax Assessment Total Assessment is a certain percentage of the fair market value that is determined by local assessors to be the total taxable value of land and additions on the property. | Land | Improvement |
|---|---|---|---|---|
| 2025 | $3,121 | $29,127 | -- | -- |
| 2024 | $3,060 | $27,740 | -- | -- |
| 2023 | $3,060 | $48,810 | $9,760 | $39,050 |
| 2022 | $2,953 | $36,400 | $7,280 | $29,120 |
| 2021 | $3,027 | $34,020 | $6,800 | $27,220 |
| 2020 | $2,946 | $30,660 | $6,130 | $24,530 |
| 2019 | $2,892 | $30,370 | $6,070 | $24,300 |
| 2018 | $2,810 | $29,050 | $5,810 | $23,240 |
| 2017 | $2,802 | $27,400 | $5,480 | $21,920 |
| 2016 | $3,121 | $25,260 | $5,050 | $20,210 |
| 2015 | $2,553 | $23,470 | $4,690 | $18,780 |
Source: Public Records
Map
Nearby Homes
- 138 E Monte Cristo Ave
- 16303 N 2nd Ave
- 15838 N 4th Ave
- 16332 N 2nd Dr
- 15427 N 2nd Ave
- 16516 N 2nd Dr
- 15450 N 2nd Place
- 16605 N 1st Dr Unit 101
- 16609 N 1st Ave Unit 76
- 16602 N 2nd Ln
- 26 E Coral Gables Dr Unit 38
- 15818 N 6th Ave
- 244 E Ponderosa Ln
- 16614 N 1st Ave Unit 92
- 16607 N 3rd Ave Unit 222
- 514 W Grandview Rd
- 16617 N 1st Ln Unit 131
- 16613 N 3rd Ave Unit 225
- 16622 N 2nd Dr Unit 182
- 15226 N 2nd St
- 10 W Monte Cristo Ave
- 102 W Monte Cristo Ave
- 16218 N 1st Ave
- 19 W Monte Cristo Ave
- 11 W Monte Cristo Ave
- 15836 N 2nd Ave
- 16220 N 1st Ave
- 15835 N 2nd Ave
- 16213 N 1st Ave
- 16201 N 1st Ave
- 15832 N 2nd Ave
- 20 W Marconi Ave
- 12 W Marconi Ave
- 16219 N 1st Ave
- 15835 N 1st Ave
- 15823 N 2nd Ave
- 16223 N 1st Ave Unit 142
- 15822 N 2nd Ave
- 16018 N 1st St
- 16010 N 1st St