18 W Shore Rd Windham, NH 03087
Estimated Value: $527,000 - $735,000
3
Beds
2
Baths
1,404
Sq Ft
$424/Sq Ft
Est. Value
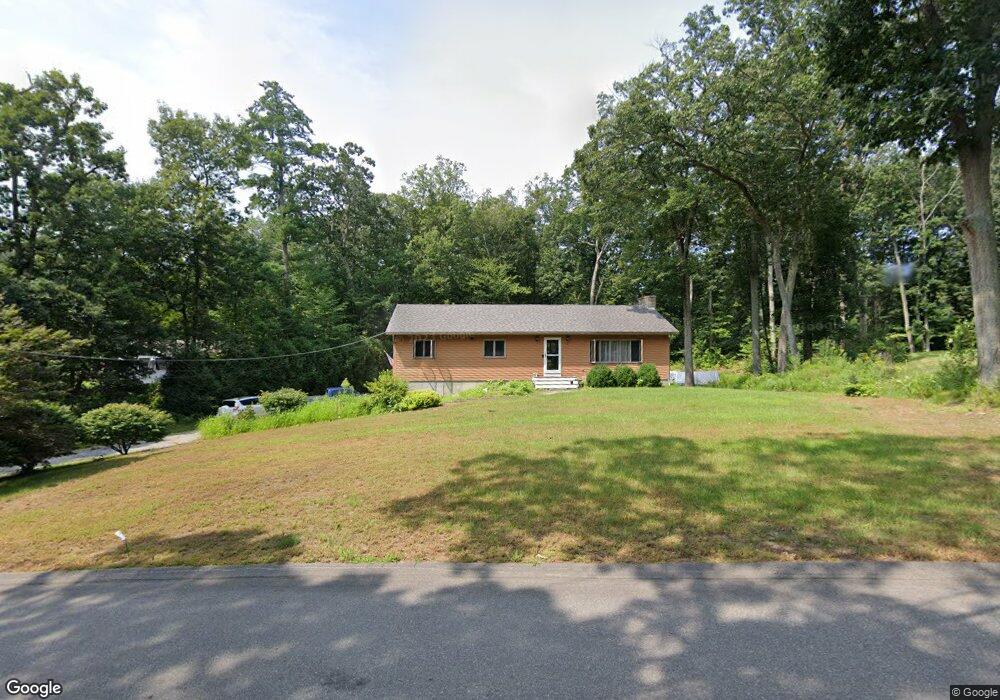
About This Home
This home is located at 18 W Shore Rd, Windham, NH 03087 and is currently estimated at $595,282, approximately $423 per square foot. 18 W Shore Rd is a home located in Rockingham County with nearby schools including Golden Brook Elementary School, Windham Middle School, and Windham High School.
Ownership History
Date
Name
Owned For
Owner Type
Purchase Details
Closed on
Dec 27, 2019
Sold by
Moran Paul J and Moran Donna
Bought by
Quale Mark J and Quale Maureen J
Current Estimated Value
Home Financials for this Owner
Home Financials are based on the most recent Mortgage that was taken out on this home.
Original Mortgage
$280,330
Outstanding Balance
$248,159
Interest Rate
3.7%
Mortgage Type
Purchase Money Mortgage
Estimated Equity
$347,123
Purchase Details
Closed on
Jul 31, 2001
Sold by
Takvorian Jane E
Bought by
Moran Paul J and Moran Donna
Home Financials for this Owner
Home Financials are based on the most recent Mortgage that was taken out on this home.
Original Mortgage
$100,000
Interest Rate
7.18%
Create a Home Valuation Report for This Property
The Home Valuation Report is an in-depth analysis detailing your home's value as well as a comparison with similar homes in the area
Home Values in the Area
Average Home Value in this Area
Purchase History
| Date | Buyer | Sale Price | Title Company |
|---|---|---|---|
| Quale Mark J | $289,000 | None Available | |
| Moran Paul J | $272,000 | -- |
Source: Public Records
Mortgage History
| Date | Status | Borrower | Loan Amount |
|---|---|---|---|
| Open | Quale Mark J | $280,330 | |
| Previous Owner | Moran Paul J | $175,000 | |
| Previous Owner | Moran Paul J | $80,000 | |
| Previous Owner | Moran Paul J | $100,000 |
Source: Public Records
Tax History
| Year | Tax Paid | Tax Assessment Tax Assessment Total Assessment is a certain percentage of the fair market value that is determined by local assessors to be the total taxable value of land and additions on the property. | Land | Improvement |
|---|---|---|---|---|
| 2024 | $8,062 | $356,100 | $180,300 | $175,800 |
| 2023 | $7,621 | $356,100 | $180,300 | $175,800 |
| 2022 | $7,037 | $356,100 | $180,300 | $175,800 |
| 2021 | $6,631 | $356,100 | $180,300 | $175,800 |
| 2020 | $6,812 | $356,100 | $180,300 | $175,800 |
| 2019 | $6,296 | $279,200 | $165,400 | $113,800 |
| 2018 | $6,183 | $265,500 | $165,400 | $100,100 |
| 2017 | $5,363 | $265,500 | $165,400 | $100,100 |
| 2016 | $5,793 | $265,500 | $165,400 | $100,100 |
| 2015 | $5,767 | $265,500 | $165,400 | $100,100 |
| 2014 | $6,456 | $269,000 | $178,000 | $91,000 |
| 2013 | $6,381 | $270,400 | $178,000 | $92,400 |
Source: Public Records
Map
Nearby Homes