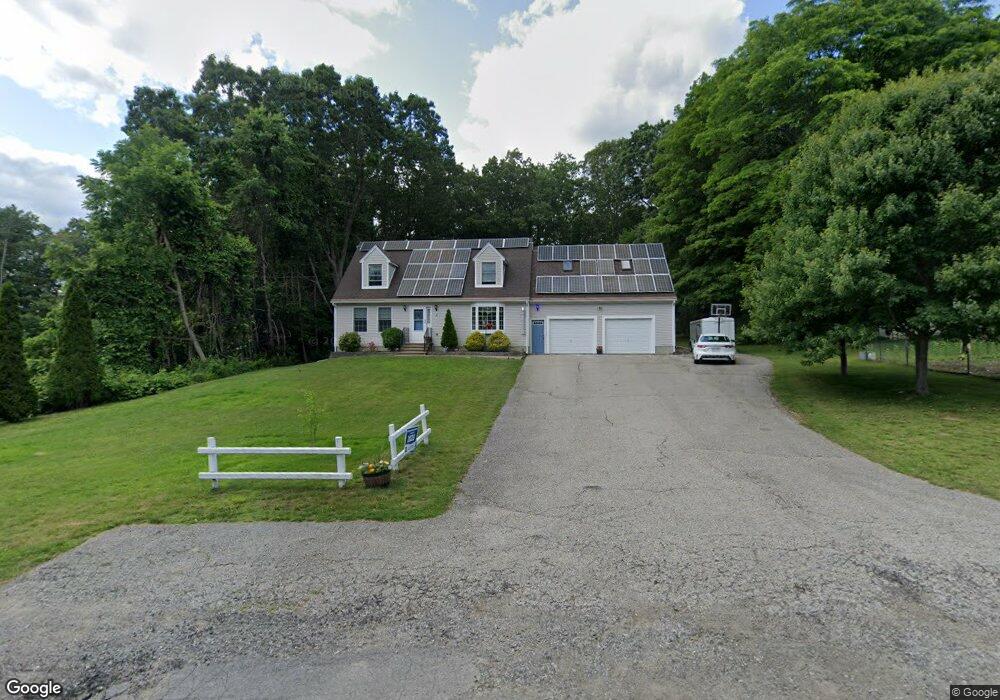
18 Walnut St Auburn, MA 01501
Stoneville NeighborhoodEstimated Value: $568,205 - $652,000
4
Beds
3
Baths
2,173
Sq Ft
$288/Sq Ft
Est. Value
About This Home
This home is located at 18 Walnut St, Auburn, MA 01501 and is currently estimated at $625,551, approximately $287 per square foot. 18 Walnut St is a home located in Worcester County with nearby schools including Auburn Senior High School and Shrewsbury Montessori School - Auburn Campus.
Ownership History
Date
Name
Owned For
Owner Type
Purchase Details
Closed on
Oct 17, 2002
Sold by
Est Sandberg John H and Sandberg Philip
Bought by
Sandberg Brian K and Mckinstry Kristin A
Current Estimated Value
Home Financials for this Owner
Home Financials are based on the most recent Mortgage that was taken out on this home.
Original Mortgage
$192,470
Interest Rate
6.18%
Mortgage Type
Purchase Money Mortgage
Create a Home Valuation Report for This Property
The Home Valuation Report is an in-depth analysis detailing your home's value as well as a comparison with similar homes in the area
Home Values in the Area
Average Home Value in this Area
Purchase History
| Date | Buyer | Sale Price | Title Company |
|---|---|---|---|
| Sandberg Brian K | $35,000 | -- |
Source: Public Records
Mortgage History
| Date | Status | Borrower | Loan Amount |
|---|---|---|---|
| Open | Sandberg Brian K | $190,000 | |
| Closed | Sandberg Brian K | $192,470 |
Source: Public Records
Tax History
| Year | Tax Paid | Tax Assessment Tax Assessment Total Assessment is a certain percentage of the fair market value that is determined by local assessors to be the total taxable value of land and additions on the property. | Land | Improvement |
|---|---|---|---|---|
| 2025 | $68 | $476,900 | $119,200 | $357,700 |
| 2024 | $7,174 | $480,500 | $114,700 | $365,800 |
| 2023 | $7,073 | $445,400 | $104,300 | $341,100 |
| 2022 | $6,496 | $386,200 | $104,300 | $281,900 |
| 2021 | $6,256 | $344,900 | $92,100 | $252,800 |
| 2020 | $6,023 | $335,000 | $92,100 | $242,900 |
| 2019 | $6,020 | $326,800 | $91,200 | $235,600 |
| 2018 | $5,884 | $319,100 | $85,300 | $233,800 |
| 2017 | $5,531 | $301,600 | $77,300 | $224,300 |
| 2016 | $5,362 | $296,400 | $79,700 | $216,700 |
| 2015 | $5,154 | $298,600 | $79,700 | $218,900 |
| 2014 | $5,018 | $290,200 | $75,700 | $214,500 |
Source: Public Records
Map
Nearby Homes
- 19-20 Williams St
- 83 Bryn Mawr Ave
- 1 Ashcroft St
- 1-9 Helens Way
- 177 Oxford St N
- 381 Oxford St N
- 31-33 Walsh Ave
- 33 Walsh Ave
- 31 Walsh Ave
- 25 Vinal St Unit 26
- 25 Vinal St Unit 29
- 25 Vinal St Unit 30
- 191 Boyce St
- 177 Boyce St
- 234 Bryn Mawr Ave
- 5 Commonwealth Ave
- 301 Forest Park Dr
- 2 Victoria Dr Unit 1
- 501 Forest Park Dr Unit 501
- 27 Havana Rd
Your Personal Tour Guide
Ask me questions while you tour the home.