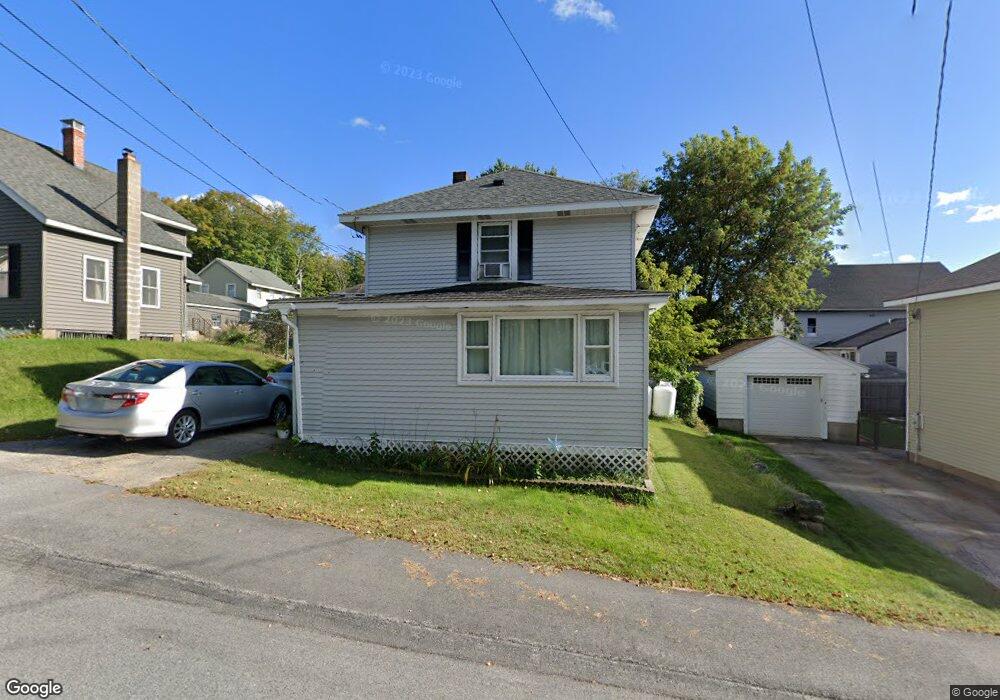
18 Webster St Allenstown, NH 03275
Suncook NeighborhoodEstimated Value: $287,000 - $375,735
2
Beds
1
Bath
1,136
Sq Ft
$289/Sq Ft
Est. Value
About This Home
This home is located at 18 Webster St, Allenstown, NH 03275 and is currently estimated at $328,184, approximately $288 per square foot. 18 Webster St is a home located in Merrimack County with nearby schools including Allenstown Elementary School, Armand R. Dupont School, and Tender Years Child Care & Learning Center.
Ownership History
Date
Name
Owned For
Owner Type
Purchase Details
Closed on
Apr 14, 2008
Sold by
Blais Tina L
Bought by
Piard Tiffany M and Nardino William J
Current Estimated Value
Home Financials for this Owner
Home Financials are based on the most recent Mortgage that was taken out on this home.
Original Mortgage
$119,892
Outstanding Balance
$77,244
Interest Rate
6.3%
Mortgage Type
Purchase Money Mortgage
Estimated Equity
$250,940
Purchase Details
Closed on
Apr 21, 2000
Sold by
Blais David A and Blais Luanne M
Bought by
Blais David A and Blais Tina L
Home Financials for this Owner
Home Financials are based on the most recent Mortgage that was taken out on this home.
Original Mortgage
$75,590
Interest Rate
8.21%
Create a Home Valuation Report for This Property
The Home Valuation Report is an in-depth analysis detailing your home's value as well as a comparison with similar homes in the area
Home Values in the Area
Average Home Value in this Area
Purchase History
| Date | Buyer | Sale Price | Title Company |
|---|---|---|---|
| Piard Tiffany M | $123,600 | -- | |
| Blais David A | $76,000 | -- |
Source: Public Records
Mortgage History
| Date | Status | Borrower | Loan Amount |
|---|---|---|---|
| Open | Blais David A | $119,892 | |
| Previous Owner | Blais David A | $75,590 |
Source: Public Records
Tax History Compared to Growth
Tax History
| Year | Tax Paid | Tax Assessment Tax Assessment Total Assessment is a certain percentage of the fair market value that is determined by local assessors to be the total taxable value of land and additions on the property. | Land | Improvement |
|---|---|---|---|---|
| 2024 | $6,980 | $274,600 | $133,800 | $140,800 |
| 2023 | $5,822 | $274,600 | $133,800 | $140,800 |
| 2022 | $5,355 | $274,600 | $133,800 | $140,800 |
| 2021 | $4,901 | $155,600 | $73,200 | $82,400 |
| 2020 | $4,559 | $155,600 | $73,200 | $82,400 |
| 2019 | $4,836 | $155,500 | $73,200 | $82,300 |
| 2018 | $4,688 | $155,500 | $73,200 | $82,300 |
| 2017 | $4,993 | $155,500 | $73,200 | $82,300 |
| 2016 | $3,789 | $111,900 | $40,500 | $71,400 |
| 2015 | $3,674 | $111,900 | $40,500 | $71,400 |
| 2014 | $3,780 | $111,900 | $40,500 | $71,400 |
| 2013 | $3,049 | $96,700 | $40,500 | $56,200 |
Source: Public Records
Map
Nearby Homes
- 7 Ferry St
- 4 Rodger Rd
- 100 Main St Unit M10
- 100 Main St Unit 204
- 12-14 Church St Unit 12,14
- 15 Main St
- 111 Glass St
- 422 Dawn Dr Unit 23
- 427 Dawn Dr Unit 15
- 1 1/2 Bartlett St
- 233 Pembroke St
- 19 Sullivan Dr
- 259 Pembroke St
- 307 Dearborn Rd
- 10 Lane Dr
- 2 Cheryl Dr
- 10 Winchester Ct
- 15 Sullivan Dr
- 1821 Hooksett Rd
- 347 Pembroke St