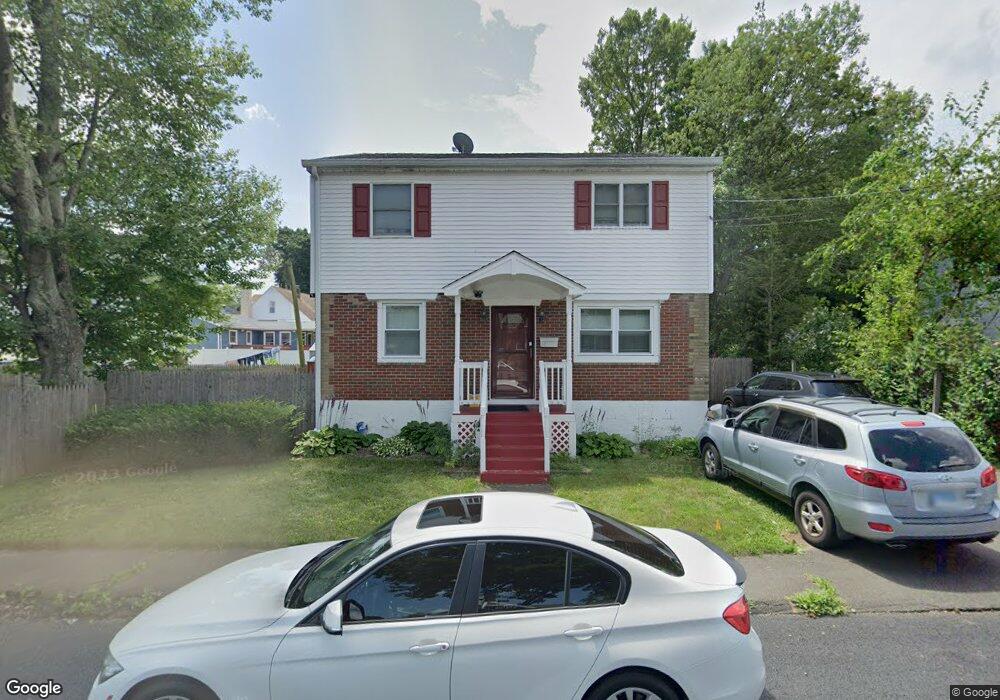
18 Whaley St Danbury, CT 06810
Estimated Value: $337,000 - $484,000
4
Beds
3
Baths
1,682
Sq Ft
$254/Sq Ft
Est. Value
About This Home
This home is located at 18 Whaley St, Danbury, CT 06810 and is currently estimated at $427,004, approximately $253 per square foot. 18 Whaley St is a home located in Fairfield County with nearby schools including Morris Street Elementary School, Rogers Park Middle School, and Danbury High School.
Ownership History
Date
Name
Owned For
Owner Type
Purchase Details
Closed on
Nov 13, 1998
Sold by
Fhlmc
Bought by
Dolberry Donald and Dolberry Brenda
Current Estimated Value
Home Financials for this Owner
Home Financials are based on the most recent Mortgage that was taken out on this home.
Original Mortgage
$124,800
Interest Rate
6.65%
Purchase Details
Closed on
Dec 12, 1989
Sold by
Capellaro Ronald
Bought by
Son Phol
Create a Home Valuation Report for This Property
The Home Valuation Report is an in-depth analysis detailing your home's value as well as a comparison with similar homes in the area
Home Values in the Area
Average Home Value in this Area
Purchase History
| Date | Buyer | Sale Price | Title Company |
|---|---|---|---|
| Dolberry Donald | $105,000 | -- | |
| Son Phol | $172,000 | -- |
Source: Public Records
Mortgage History
| Date | Status | Borrower | Loan Amount |
|---|---|---|---|
| Open | Son Phol | $328,500 | |
| Closed | Son Phol | $282,000 | |
| Closed | Son Phol | $181,177 | |
| Closed | Son Phol | $124,800 |
Source: Public Records
Tax History
| Year | Tax Paid | Tax Assessment Tax Assessment Total Assessment is a certain percentage of the fair market value that is determined by local assessors to be the total taxable value of land and additions on the property. | Land | Improvement |
|---|---|---|---|---|
| 2025 | $5,047 | $201,950 | $60,550 | $141,400 |
| 2024 | $4,936 | $201,950 | $60,550 | $141,400 |
| 2023 | $4,711 | $201,950 | $60,550 | $141,400 |
| 2022 | $4,013 | $142,200 | $63,200 | $79,000 |
| 2021 | $3,925 | $142,200 | $63,200 | $79,000 |
| 2020 | $3,925 | $142,200 | $63,200 | $79,000 |
| 2019 | $3,925 | $142,200 | $63,200 | $79,000 |
| 2018 | $3,925 | $142,200 | $63,200 | $79,000 |
| 2017 | $3,874 | $133,800 | $60,200 | $73,600 |
| 2016 | $3,837 | $133,800 | $60,200 | $73,600 |
| 2015 | $4,098 | $145,000 | $60,200 | $84,800 |
| 2014 | $4,002 | $145,000 | $60,200 | $84,800 |
Source: Public Records
Map
Nearby Homes
- 67 B Westville Ave
- 18 Grandview Ave
- 70 Westville Ave
- 17 Staples St
- 34 Mallory St
- 8 Ann Dr Unit B
- 22 Irving Place
- 59 Pleasant St
- 57 Pleasant St
- 23 Franklin St Unit 1
- 22 Robinson Ave
- 10 Scuppo Rd Unit A13
- 26 Crescent Dr
- 5 -7-9 Patch St
- 26 Walden Ct Unit Lot 6
- 12 Scuppo Rd Unit D4
- 81 Park Ave Unit 2008
- 63A Main St
- 31 William St
- 1 Union Ave Unit 11
Your Personal Tour Guide
Ask me questions while you tour the home.