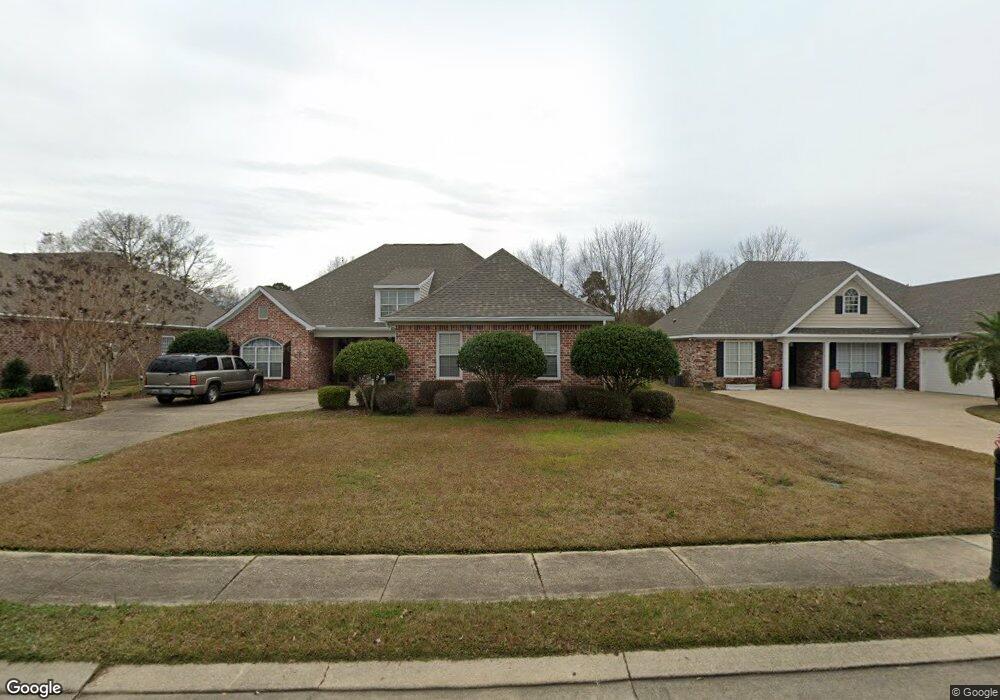
18 Wilshire Blvd Laurel, MS 39443
Estimated Value: $307,880 - $392,000
4
Beds
2
Baths
2,476
Sq Ft
$142/Sq Ft
Est. Value
About This Home
This home is located at 18 Wilshire Blvd, Laurel, MS 39443 and is currently estimated at $351,220, approximately $141 per square foot. 18 Wilshire Blvd is a home located in Jones County with nearby schools including Laurel Middle School, Laurel Christian High School, and Immaculate Conception School.
Ownership History
Date
Name
Owned For
Owner Type
Purchase Details
Closed on
Sep 5, 2019
Sold by
Martin Justin C
Bought by
Thames William Lawrence
Current Estimated Value
Home Financials for this Owner
Home Financials are based on the most recent Mortgage that was taken out on this home.
Original Mortgage
$220,000
Outstanding Balance
$192,281
Interest Rate
3.6%
Mortgage Type
New Conventional
Estimated Equity
$158,939
Purchase Details
Closed on
Oct 24, 2014
Bought by
Martin Justin C and Martin Marisa L
Home Financials for this Owner
Home Financials are based on the most recent Mortgage that was taken out on this home.
Original Mortgage
$25,058,890
Interest Rate
4.26%
Mortgage Type
Stand Alone Refi Refinance Of Original Loan
Purchase Details
Closed on
May 3, 2011
Sold by
Burroughs Greg and Burroughs Meredith Brook
Bought by
Burroughs Greg
Purchase Details
Closed on
Aug 13, 2010
Sold by
Burton Properties Llc
Bought by
Burroughs Greg and Burroughs Meredith Brook
Create a Home Valuation Report for This Property
The Home Valuation Report is an in-depth analysis detailing your home's value as well as a comparison with similar homes in the area
Home Values in the Area
Average Home Value in this Area
Purchase History
| Date | Buyer | Sale Price | Title Company |
|---|---|---|---|
| Thames William Lawrence | -- | -- | |
| Martin Justin C | -- | -- | |
| Burroughs Greg | -- | -- | |
| Burroughs Greg | -- | -- |
Source: Public Records
Mortgage History
| Date | Status | Borrower | Loan Amount |
|---|---|---|---|
| Open | Thames William Lawrence | $220,000 | |
| Previous Owner | Martin Justin C | $25,058,890 |
Source: Public Records
Tax History Compared to Growth
Tax History
| Year | Tax Paid | Tax Assessment Tax Assessment Total Assessment is a certain percentage of the fair market value that is determined by local assessors to be the total taxable value of land and additions on the property. | Land | Improvement |
|---|---|---|---|---|
| 2025 | $3,359 | $20,114 | $0 | $0 |
| 2024 | $3,359 | $21,258 | $0 | $0 |
| 2023 | $3,359 | $21,258 | $0 | $0 |
| 2022 | $3,330 | $21,258 | $0 | $0 |
| 2021 | $3,341 | $21,258 | $0 | $0 |
| 2020 | $3,440 | $21,547 | $0 | $0 |
| 2019 | $3,451 | $21,547 | $0 | $0 |
| 2018 | $3,451 | $21,547 | $0 | $0 |
| 2017 | $3,361 | $21,547 | $0 | $0 |
| 2016 | $3,412 | $22,359 | $0 | $0 |
| 2015 | $3,250 | $22,359 | $0 | $0 |
| 2014 | $3,250 | $22,359 | $0 | $0 |
Source: Public Records
Map
Nearby Homes
- 3 Brianleigh Dr
- 7 & 9 Amyden Ct
- Lot 806 Joshbury Cir
- Lot 805 Joshbury Cir
- 18 Joshbury Cir
- 4 Katyford Dr
- 5 Westerly Dr
- 10 Westerly Dr
- 3101 Old Amy Rd
- 3011 Wansley Rd
- 2710 Old Amy Rd
- Forest Glen Dr
- 0 Reeves Rd
- 41 Flynt Rd
- 0 Off of Forest Glen Dr Unit 4103953
- 1428 33rd St
- 62 Wilcher Dr
- 0 Wansley Rd
- 160 Reeves Rd
- 6 Stonesthrow Dr
- 16 Wilshire Blvd
- 20 Wilshire Blvd
- 0 Wilshire Blvd
- 22 Wilshire Blvd
- 14 Wilshire Blvd
- 17 Wilshire Blvd
- 19 Wilshire Blvd
- 12 Wilshire Blvd
- 15 Wilshire Blvd
- 24 Wilshire Blvd
- 21 Wilshire Blvd
- 13 Wilshire Blvd
- 23 Wilshire Blvd
- 26 Wilshire Blvd
- 10 Wilshire Blvd
- 11 Wilshire Blvd
- 25 Wilshire Blvd
- 12 Brianleigh Dr
- 10 Brianleigh Dr
- 8 Wilshire Blvd