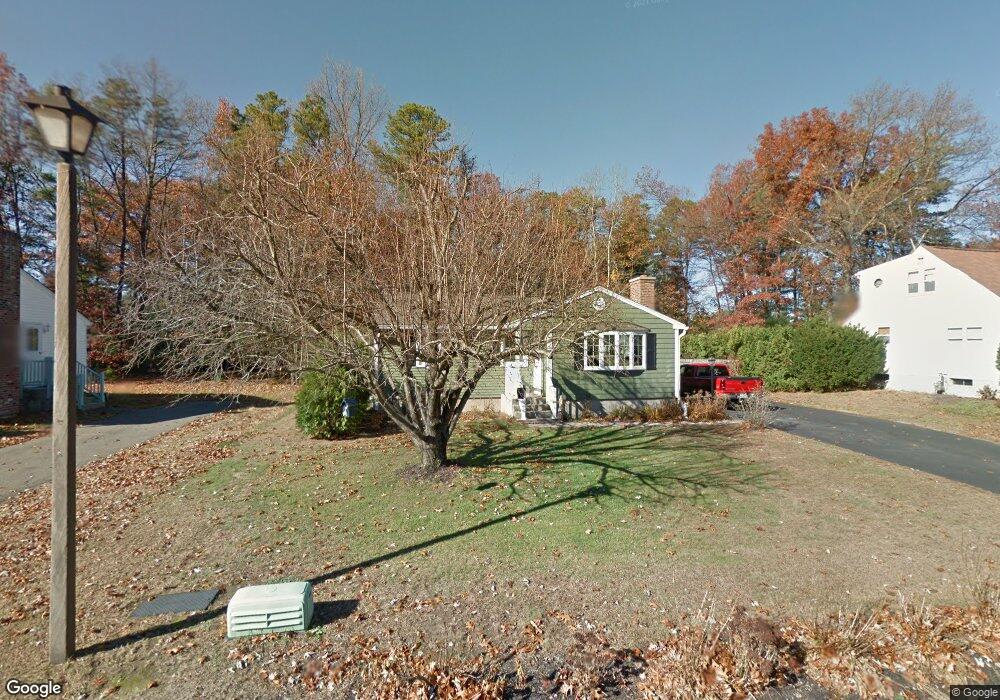
18 Zabek Dr Easthampton, MA 01027
Estimated Value: $324,000 - $356,000
3
Beds
2
Baths
976
Sq Ft
$351/Sq Ft
Est. Value
About This Home
This home is located at 18 Zabek Dr, Easthampton, MA 01027 and is currently estimated at $342,869, approximately $351 per square foot. 18 Zabek Dr is a home located in Hampshire County with nearby schools including Easthampton High School, Calvary Baptist Christian School, and Tri-County Schools.
Ownership History
Date
Name
Owned For
Owner Type
Purchase Details
Closed on
Mar 12, 2024
Sold by
Malinowski Steven R and Malinowski Karen R
Bought by
Malinowski Bryan and Malinowski Justin
Current Estimated Value
Purchase Details
Closed on
Mar 28, 1988
Sold by
Jasinski Stanley
Bought by
Malinowski Steven R
Home Financials for this Owner
Home Financials are based on the most recent Mortgage that was taken out on this home.
Original Mortgage
$80,800
Interest Rate
9.82%
Mortgage Type
Purchase Money Mortgage
Create a Home Valuation Report for This Property
The Home Valuation Report is an in-depth analysis detailing your home's value as well as a comparison with similar homes in the area
Home Values in the Area
Average Home Value in this Area
Purchase History
| Date | Buyer | Sale Price | Title Company |
|---|---|---|---|
| Malinowski Bryan | -- | None Available | |
| Malinowski Steven R | $101,000 | -- |
Source: Public Records
Mortgage History
| Date | Status | Borrower | Loan Amount |
|---|---|---|---|
| Previous Owner | Malinowski Steven R | $80,800 |
Source: Public Records
Tax History
| Year | Tax Paid | Tax Assessment Tax Assessment Total Assessment is a certain percentage of the fair market value that is determined by local assessors to be the total taxable value of land and additions on the property. | Land | Improvement |
|---|---|---|---|---|
| 2025 | $4,310 | $315,300 | $118,300 | $197,000 |
| 2024 | $4,162 | $306,900 | $114,900 | $192,000 |
| 2023 | $3,192 | $217,900 | $90,400 | $127,500 |
| 2022 | $3,602 | $217,900 | $90,400 | $127,500 |
| 2021 | $3,931 | $224,100 | $90,400 | $133,700 |
| 2020 | $3,870 | $217,900 | $90,400 | $127,500 |
| 2019 | $3,063 | $198,100 | $90,400 | $107,700 |
| 2018 | $2,949 | $184,300 | $85,400 | $98,900 |
| 2017 | $2,881 | $177,700 | $82,100 | $95,600 |
| 2016 | $2,961 | $189,900 | $82,100 | $107,800 |
| 2015 | $2,877 | $189,900 | $82,100 | $107,800 |
Source: Public Records
Map
Nearby Homes
Your Personal Tour Guide
Ask me questions while you tour the home.