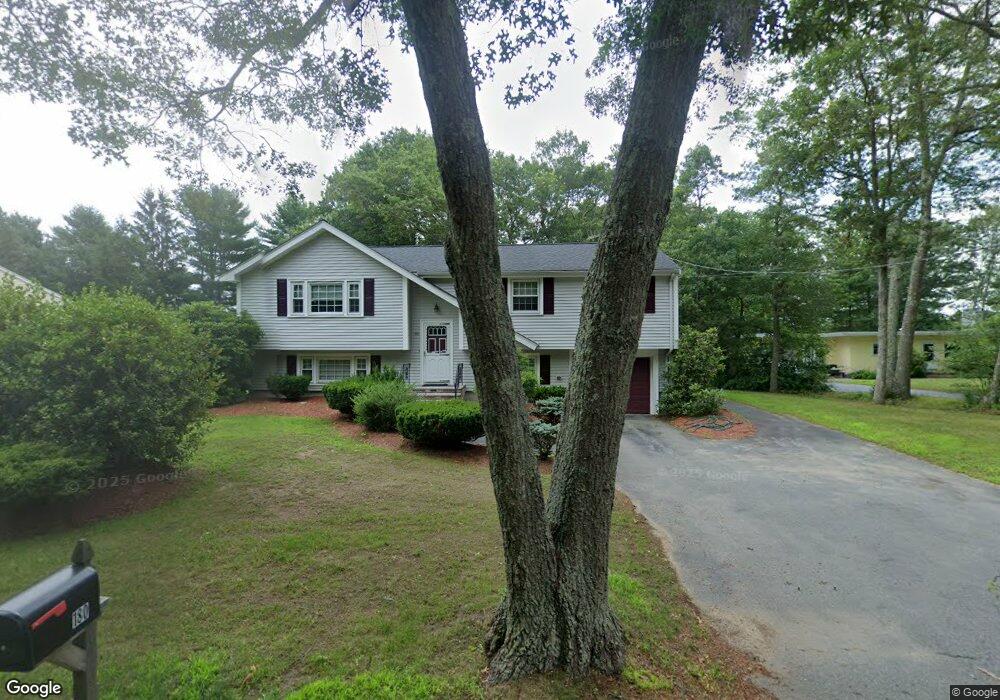
180 Chemung St Stoughton, MA 02072
Estimated Value: $659,962 - $683,000
3
Beds
2
Baths
1,927
Sq Ft
$347/Sq Ft
Est. Value
About This Home
This home is located at 180 Chemung St, Stoughton, MA 02072 and is currently estimated at $668,491, approximately $346 per square foot. 180 Chemung St is a home located in Norfolk County with nearby schools including Helen Hansen Elementary School, Dr. Robert G. O'Donnell Middle School, and Stoughton High School.
Ownership History
Date
Name
Owned For
Owner Type
Purchase Details
Closed on
Jun 28, 2017
Sold by
Chemung Heritage Rt and Shufrin
Bought by
Shufrin Ronald C
Current Estimated Value
Purchase Details
Closed on
Sep 19, 2011
Sold by
Shufrin Esther A
Bought by
Chemung Heritage Rt and Shufrin
Purchase Details
Closed on
Oct 11, 1972
Bought by
Chemung Heritage Rt
Create a Home Valuation Report for This Property
The Home Valuation Report is an in-depth analysis detailing your home's value as well as a comparison with similar homes in the area
Home Values in the Area
Average Home Value in this Area
Purchase History
| Date | Buyer | Sale Price | Title Company |
|---|---|---|---|
| Shufrin Ronald C | -- | -- | |
| Shufrin Ronald C | -- | -- | |
| Shufrin Ronald C | -- | -- | |
| Chemung Heritage Rt | -- | -- | |
| Chemung Heritage Rt | -- | -- | |
| Chemung Heritage Rt | -- | -- |
Source: Public Records
Tax History Compared to Growth
Tax History
| Year | Tax Paid | Tax Assessment Tax Assessment Total Assessment is a certain percentage of the fair market value that is determined by local assessors to be the total taxable value of land and additions on the property. | Land | Improvement |
|---|---|---|---|---|
| 2025 | $6,551 | $529,200 | $217,800 | $311,400 |
| 2024 | $6,355 | $499,200 | $198,400 | $300,800 |
| 2023 | $6,141 | $453,200 | $184,400 | $268,800 |
| 2022 | $5,901 | $409,500 | $168,600 | $240,900 |
| 2021 | $5,752 | $380,900 | $152,800 | $228,100 |
| 2020 | $5,453 | $366,200 | $147,500 | $218,700 |
| 2019 | $5,493 | $358,100 | $147,500 | $210,600 |
| 2018 | $4,834 | $326,400 | $140,500 | $185,900 |
| 2017 | $4,547 | $313,800 | $133,500 | $180,300 |
| 2016 | $4,406 | $294,300 | $122,900 | $171,400 |
| 2015 | $4,347 | $287,300 | $115,900 | $171,400 |
| 2014 | $4,239 | $269,300 | $105,400 | $163,900 |
Source: Public Records
Map
Nearby Homes