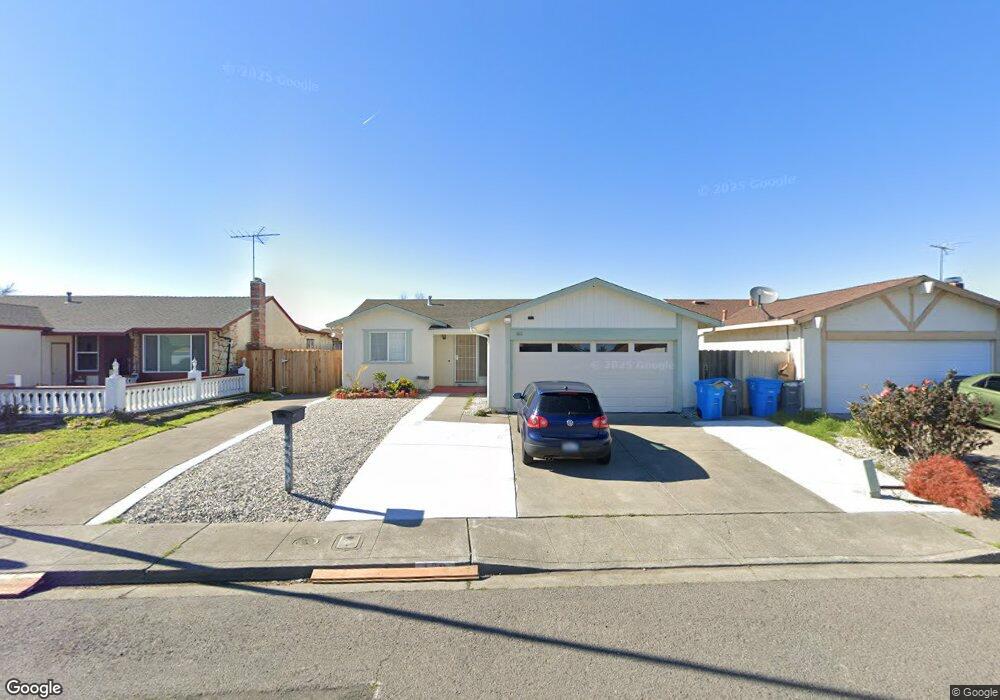
180 Coloma Way Vallejo, CA 94589
North Vallejo NeighborhoodEstimated Value: $483,000 - $520,000
3
Beds
2
Baths
1,400
Sq Ft
$362/Sq Ft
Est. Value
About This Home
This home is located at 180 Coloma Way, Vallejo, CA 94589 and is currently estimated at $507,120, approximately $362 per square foot. 180 Coloma Way is a home located in Solano County with nearby schools including Dan Mini Elementary School, Solano Middle School, and Vallejo High School.
Ownership History
Date
Name
Owned For
Owner Type
Purchase Details
Closed on
Sep 25, 2024
Sold by
Martinez Rustico T and Martinez Wenny V
Bought by
Martinez Family Trust and Martinez
Current Estimated Value
Purchase Details
Closed on
Aug 17, 2018
Sold by
Sarreal Danilo S and Sarreal Nerissa
Bought by
Martinez Rustico T and Martinez Wenny V
Home Financials for this Owner
Home Financials are based on the most recent Mortgage that was taken out on this home.
Original Mortgage
$363,750
Interest Rate
4.5%
Mortgage Type
New Conventional
Purchase Details
Closed on
Jun 9, 2003
Sold by
Sarreal Danilo S and Sarreal Nerissa
Bought by
Sarreal Danilo S and Sarreal Nerissa
Create a Home Valuation Report for This Property
The Home Valuation Report is an in-depth analysis detailing your home's value as well as a comparison with similar homes in the area
Home Values in the Area
Average Home Value in this Area
Purchase History
| Date | Buyer | Sale Price | Title Company |
|---|---|---|---|
| Martinez Family Trust | -- | None Listed On Document | |
| Martinez Rustico T | $375,000 | Old Republic Title Co | |
| Sarreal Chester Z | -- | Old Republic Title Co | |
| Sarreal Danilo S | $26,500 | -- |
Source: Public Records
Mortgage History
| Date | Status | Borrower | Loan Amount |
|---|---|---|---|
| Previous Owner | Martinez Rustico T | $363,750 |
Source: Public Records
Tax History
| Year | Tax Paid | Tax Assessment Tax Assessment Total Assessment is a certain percentage of the fair market value that is determined by local assessors to be the total taxable value of land and additions on the property. | Land | Improvement |
|---|---|---|---|---|
| 2025 | $5,695 | $418,315 | $100,394 | $317,921 |
| 2024 | $5,695 | $410,114 | $98,427 | $311,687 |
| 2023 | $5,389 | $402,074 | $96,498 | $305,576 |
| 2022 | $5,303 | $394,191 | $94,606 | $299,585 |
| 2021 | $5,186 | $386,462 | $92,751 | $293,711 |
| 2020 | $5,222 | $382,500 | $91,800 | $290,700 |
| 2019 | $5,074 | $375,000 | $90,000 | $285,000 |
| 2018 | $1,927 | $110,042 | $22,329 | $87,713 |
| 2017 | $1,822 | $107,886 | $21,892 | $85,994 |
| 2016 | $1,251 | $105,771 | $21,463 | $84,308 |
| 2015 | $1,235 | $104,183 | $21,141 | $83,042 |
| 2014 | $1,218 | $102,143 | $20,727 | $81,416 |
Source: Public Records
Map
Nearby Homes
- 1335 Jack London Dr
- 1355 Jack London Dr
- 570 Newport Way
- 130 Kennison Ct
- 148 Obrien Cir
- 1001 Jack London Dr
- 552 Cattail Ct
- 568 Cattail Ct
- 316 Meadows Dr
- 1537 Mini Dr
- 240 Rinaldo Dr
- 35 Marla Dr
- 446 Kensington Way
- 121 Forsythia Ct
- 601 Danrose Dr
- 116 Bret Harte Way
- 705 Danrose Dr
- 203 Baylor Dr Unit 11
- 141 Dartmouth Ave
- 151 Marquette Ave
Your Personal Tour Guide
Ask me questions while you tour the home.