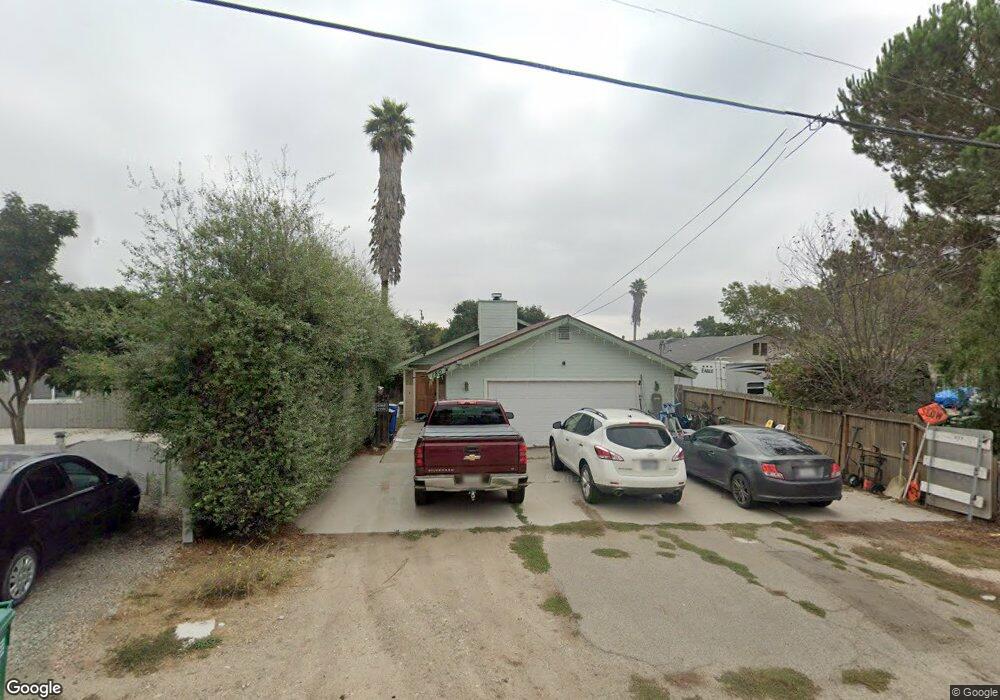
180 E Tefft St Nipomo, CA 93444
Estimated Value: $538,499 - $647,000
3
Beds
2
Baths
1,240
Sq Ft
$484/Sq Ft
Est. Value
About This Home
This home is located at 180 E Tefft St, Nipomo, CA 93444 and is currently estimated at $600,375, approximately $484 per square foot. 180 E Tefft St is a home located in San Luis Obispo County with nearby schools including Nipomo Elementary School, Mesa Middle School, and Nipomo High School.
Ownership History
Date
Name
Owned For
Owner Type
Purchase Details
Closed on
Nov 10, 2011
Sold by
Mid State Properties Llc
Bought by
Renner Nicholas J
Current Estimated Value
Home Financials for this Owner
Home Financials are based on the most recent Mortgage that was taken out on this home.
Original Mortgage
$245,918
Outstanding Balance
$166,962
Interest Rate
3.93%
Mortgage Type
New Conventional
Estimated Equity
$433,413
Purchase Details
Closed on
May 16, 2011
Sold by
Marlett Phyllis and Marlett Stephanie
Bought by
Mid State Properties Llc
Purchase Details
Closed on
Aug 25, 2008
Sold by
Marlett Stephanie
Bought by
Marlett Phyllis
Purchase Details
Closed on
Jan 13, 2006
Sold by
Eager Pamela K
Bought by
Marlett Phyllis and Marlett Stephanie
Home Financials for this Owner
Home Financials are based on the most recent Mortgage that was taken out on this home.
Original Mortgage
$155,600
Interest Rate
6.32%
Mortgage Type
Purchase Money Mortgage
Create a Home Valuation Report for This Property
The Home Valuation Report is an in-depth analysis detailing your home's value as well as a comparison with similar homes in the area
Home Values in the Area
Average Home Value in this Area
Purchase History
| Date | Buyer | Sale Price | Title Company |
|---|---|---|---|
| Renner Nicholas J | $241,000 | First American Title Company | |
| Mid State Properties Llc | $139,337 | None Available | |
| Marlett Phyllis | $45,000 | None Available | |
| Marlett Phyllis | $435,000 | Cuesta Title Company |
Source: Public Records
Mortgage History
| Date | Status | Borrower | Loan Amount |
|---|---|---|---|
| Open | Renner Nicholas J | $245,918 | |
| Previous Owner | Marlett Phyllis | $155,600 |
Source: Public Records
Tax History
| Year | Tax Paid | Tax Assessment Tax Assessment Total Assessment is a certain percentage of the fair market value that is determined by local assessors to be the total taxable value of land and additions on the property. | Land | Improvement |
|---|---|---|---|---|
| 2025 | $3,040 | $302,696 | $125,599 | $177,097 |
| 2024 | $3,004 | $296,762 | $123,137 | $173,625 |
| 2023 | $3,004 | $290,944 | $120,723 | $170,221 |
| 2022 | $2,957 | $285,240 | $118,356 | $166,884 |
| 2021 | $2,950 | $279,648 | $116,036 | $163,612 |
| 2020 | $2,916 | $276,782 | $114,847 | $161,935 |
| 2019 | $2,896 | $271,356 | $112,596 | $158,760 |
| 2018 | $2,860 | $266,037 | $110,389 | $155,648 |
| 2017 | $2,805 | $260,822 | $108,225 | $152,597 |
| 2016 | $2,719 | $255,708 | $106,103 | $149,605 |
| 2015 | $2,680 | $251,868 | $104,510 | $147,358 |
| 2014 | $2,580 | $246,935 | $102,463 | $144,472 |
Source: Public Records
Map
Nearby Homes
- 189 E Tefft St
- 195 E Tefft St
- 192 E Branch St
- 150 E Chestnut St
- 195 E Chestnut St
- 239 E Branch St
- 247 E Branch St
- 285 E Tefft St
- 1 W Branch St
- 0 S Burton St
- 90111003 W Price St
- 267 W Tefft St
- 136 Clearwater Ln
- 215 Rancho Rd
- 449 W Tefft St
- 449 W Tefft St Unit 23
- 449 W Tefft St Unit 22
- 449 W Tefft St Unit 13
- 160 San Antonio Ln
- 525 Grande Ave Unit D
Your Personal Tour Guide
Ask me questions while you tour the home.