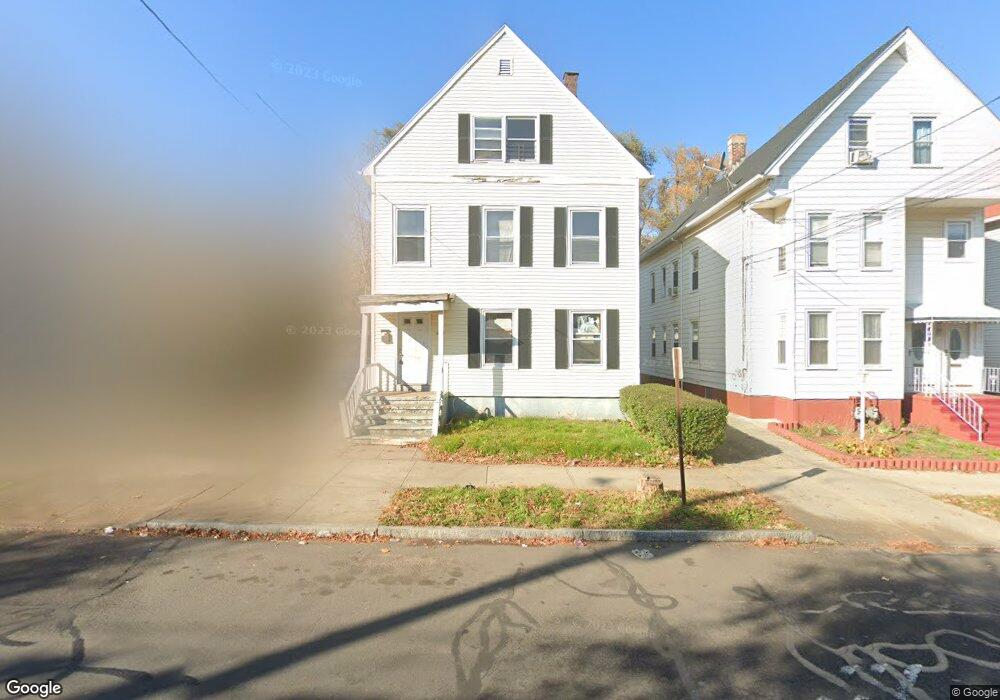
180 Farren Ave New Haven, CT 06513
Fair Haven Heights NeighborhoodEstimated Value: $319,000 - $440,000
6
Beds
3
Baths
2,963
Sq Ft
$127/Sq Ft
Est. Value
About This Home
This home is located at 180 Farren Ave, New Haven, CT 06513 and is currently estimated at $377,333, approximately $127 per square foot. 180 Farren Ave is a home located in New Haven County with nearby schools including Ross Woodward, Cold Spring School, and St Francis & St Rose Of Lima School.
Ownership History
Date
Name
Owned For
Owner Type
Purchase Details
Closed on
May 16, 2024
Sold by
Kv Investments Llc
Bought by
Ct 180 Farren Llc
Current Estimated Value
Home Financials for this Owner
Home Financials are based on the most recent Mortgage that was taken out on this home.
Original Mortgage
$367,500
Outstanding Balance
$361,602
Interest Rate
6.82%
Mortgage Type
Commercial
Estimated Equity
$15,731
Purchase Details
Closed on
May 10, 2024
Sold by
Craig Barton J
Bought by
Kv Investments Llc
Home Financials for this Owner
Home Financials are based on the most recent Mortgage that was taken out on this home.
Original Mortgage
$367,500
Outstanding Balance
$361,602
Interest Rate
6.82%
Mortgage Type
Commercial
Estimated Equity
$15,731
Purchase Details
Closed on
Dec 12, 2002
Sold by
Sobocinski Lucy D
Bought by
Craig Barton J
Create a Home Valuation Report for This Property
The Home Valuation Report is an in-depth analysis detailing your home's value as well as a comparison with similar homes in the area
Home Values in the Area
Average Home Value in this Area
Purchase History
| Date | Buyer | Sale Price | Title Company |
|---|---|---|---|
| Ct 180 Farren Llc | $325,000 | None Available | |
| Ct 180 Farren Llc | $325,000 | None Available | |
| Kv Investments Llc | $275,000 | None Available | |
| Kv Investments Llc | $275,000 | None Available | |
| Craig Barton J | $130,000 | -- |
Source: Public Records
Mortgage History
| Date | Status | Borrower | Loan Amount |
|---|---|---|---|
| Open | Ct 180 Farren Llc | $367,500 | |
| Closed | Ct 180 Farren Llc | $367,500 |
Source: Public Records
Tax History Compared to Growth
Tax History
| Year | Tax Paid | Tax Assessment Tax Assessment Total Assessment is a certain percentage of the fair market value that is determined by local assessors to be the total taxable value of land and additions on the property. | Land | Improvement |
|---|---|---|---|---|
| 2025 | $7,689 | $195,160 | $40,880 | $154,280 |
| 2024 | $7,487 | $194,460 | $40,880 | $153,580 |
| 2023 | $7,234 | $194,460 | $40,880 | $153,580 |
| 2022 | $7,730 | $194,460 | $40,880 | $153,580 |
| 2021 | $5,845 | $133,210 | $26,810 | $106,400 |
| 2020 | $5,845 | $133,210 | $26,810 | $106,400 |
| 2019 | $5,725 | $133,210 | $26,810 | $106,400 |
| 2018 | $5,725 | $133,210 | $26,810 | $106,400 |
| 2017 | $5,153 | $133,210 | $26,810 | $106,400 |
| 2016 | $4,590 | $110,460 | $25,270 | $85,190 |
| 2015 | $4,590 | $110,460 | $25,270 | $85,190 |
| 2014 | $4,590 | $110,460 | $25,270 | $85,190 |
Source: Public Records
Map
Nearby Homes
- 190 Farren Ave
- 196 Farren Ave
- 193 Farren Ave
- 12 E Ferry St
- 172 Quinnipiac Ave
- 28 Farren Ave
- 95 Lenox St Unit L
- 1 Front St Unit 1 Kel
- 121 Lexington Ave Unit 21
- 33 Chapel St
- 74 Milton St
- 32 E Pearl St
- 111 Chapel St
- 43 E Pearl St
- 8 Front St Unit D
- 191 Ferry St
- 225 Fulton Terrace
- 35 Saltonstall Ave
- 533 Quinnipiac Ave
- 114 Blatchley Ave
- 182 Farren Ave
- 186 Farren Ave Unit 3
- 168 Farren Ave
- 239 Fairmont Ave
- 247 Fairmont Ave
- 194 Farren Ave
- 195 Farren Ave Unit 2R
- 162 Farren Ave
- 191 Farren Ave
- 179 Farren Ave
- 169 Farren Ave
- 183 Farren Ave
- 257 Fairmont Ave
- 185 Farren Ave
- 156 Farren Ave
- 165 Farren Ave
- 189 Farren Ave
- 161 Farren Ave
- 200 Farren Ave
- 248 Fairmont Ave