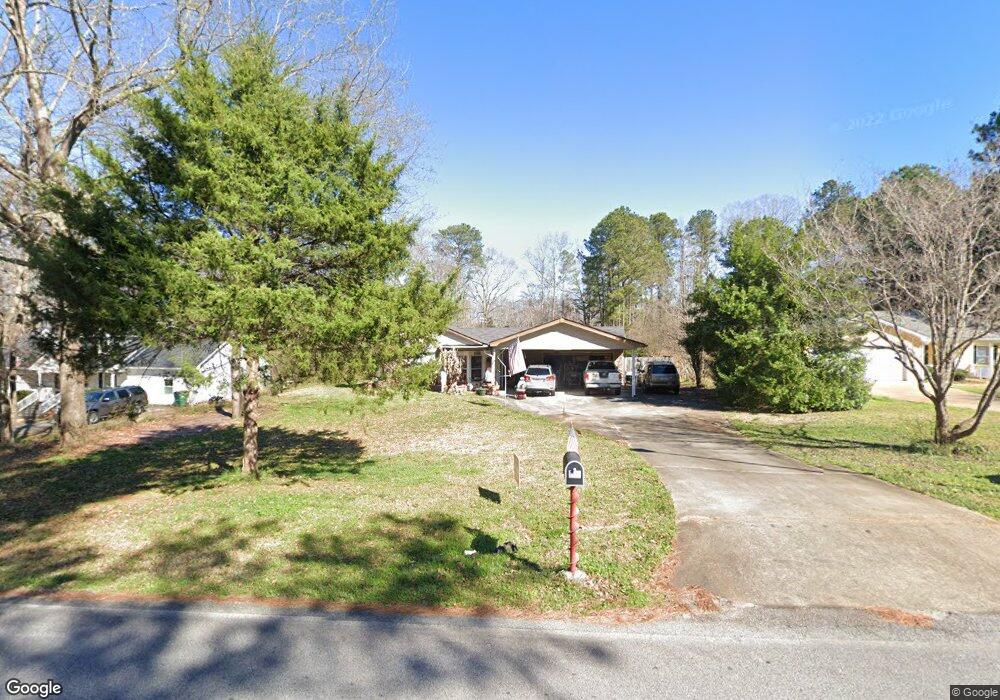
180 Laurel Way Covington, GA 30016
Estimated Value: $219,973 - $259,000
--
Bed
2
Baths
1,336
Sq Ft
$185/Sq Ft
Est. Value
About This Home
This home is located at 180 Laurel Way, Covington, GA 30016 and is currently estimated at $246,493, approximately $184 per square foot. 180 Laurel Way is a home located in Newton County with nearby schools including Livingston Elementary School, Liberty Middle School, and Alcovy High School.
Ownership History
Date
Name
Owned For
Owner Type
Purchase Details
Closed on
Mar 19, 1999
Sold by
Moody James T
Bought by
Moody James T and Moody Jessica W
Current Estimated Value
Home Financials for this Owner
Home Financials are based on the most recent Mortgage that was taken out on this home.
Original Mortgage
$57,850
Outstanding Balance
$14,120
Interest Rate
6.85%
Mortgage Type
FHA
Estimated Equity
$232,373
Purchase Details
Closed on
Jan 19, 1999
Sold by
Tyo Jason E
Bought by
Chase Manhatten Mtg Corp
Home Financials for this Owner
Home Financials are based on the most recent Mortgage that was taken out on this home.
Original Mortgage
$57,850
Outstanding Balance
$14,120
Interest Rate
6.85%
Mortgage Type
FHA
Estimated Equity
$232,373
Purchase Details
Closed on
May 18, 1994
Sold by
Shipp James
Bought by
Tyo Jason
Home Financials for this Owner
Home Financials are based on the most recent Mortgage that was taken out on this home.
Original Mortgage
$71,500
Interest Rate
8.24%
Create a Home Valuation Report for This Property
The Home Valuation Report is an in-depth analysis detailing your home's value as well as a comparison with similar homes in the area
Home Values in the Area
Average Home Value in this Area
Purchase History
| Date | Buyer | Sale Price | Title Company |
|---|---|---|---|
| Moody James T | -- | -- | |
| Moody James T | $79,900 | -- | |
| Chase Manhatten Mtg Corp | -- | -- | |
| Tyo Jason | $70,000 | -- |
Source: Public Records
Mortgage History
| Date | Status | Borrower | Loan Amount |
|---|---|---|---|
| Open | Moody James T | $57,850 | |
| Previous Owner | Tyo Jason | $71,500 |
Source: Public Records
Tax History Compared to Growth
Tax History
| Year | Tax Paid | Tax Assessment Tax Assessment Total Assessment is a certain percentage of the fair market value that is determined by local assessors to be the total taxable value of land and additions on the property. | Land | Improvement |
|---|---|---|---|---|
| 2024 | $1,586 | $102,720 | $14,800 | $87,920 |
| 2023 | $1,806 | $94,200 | $10,000 | $84,200 |
| 2022 | $1,932 | $73,720 | $10,000 | $63,720 |
| 2021 | $1,787 | $61,600 | $8,800 | $52,800 |
| 2020 | $1,656 | $52,160 | $7,200 | $44,960 |
| 2019 | $1,647 | $51,160 | $7,200 | $43,960 |
| 2018 | $1,466 | $45,600 | $7,200 | $38,400 |
| 2017 | $1,252 | $39,360 | $6,000 | $33,360 |
| 2016 | $1,148 | $36,320 | $3,800 | $32,520 |
| 2015 | $889 | $28,720 | $3,200 | $25,520 |
| 2014 | $888 | $28,720 | $0 | $0 |
Source: Public Records
Map
Nearby Homes
- 230 Laurel Way
- 270 Wellbrook Dr
- 30 Laurel Way
- 455 Bethany Rd
- 35 Green Hill Ct
- 115 Arthurs Ln
- 335 Glen Echo Dr
- 66 Ellis Trail
- 624 Bethany Rd
- 0 Highway 81 S Unit 7670352
- 15 Glen Echo Dr
- 1299 Covered Bridge Rd
- 245 Belmont Trail
- 160 Cross Rd
- 15 Granville Ln
- 190 Oak Hill Cir
- 230 Belmont Trail
- The Northview Plan at Hampton Place Estates
- The Carrollton Plan at Hampton Place Estates
- 170 Laurel Way
- 190 Laurel Way
- 160 Laurel Way
- 160 Laurel Way
- 200 Laurel Way
- 150 Laurel Way
- 175 Laurel Way
- 175 Laurel Way Unit 3
- 185 Laurel Way
- 0 Laurel Way Unit 8438302
- 0 Laurel Way Unit 8951274
- 0 Laurel Way Unit 9042404
- 0 Laurel Way Unit 3209907
- 0 Laurel Way Unit 7401393
- 0 Laurel Way Unit 8236551
- 0 Laurel Way Unit 8260033
- 165 Laurel Way
- 210 Laurel Way
- 195 Laurel Way
- 155 Laurel Way