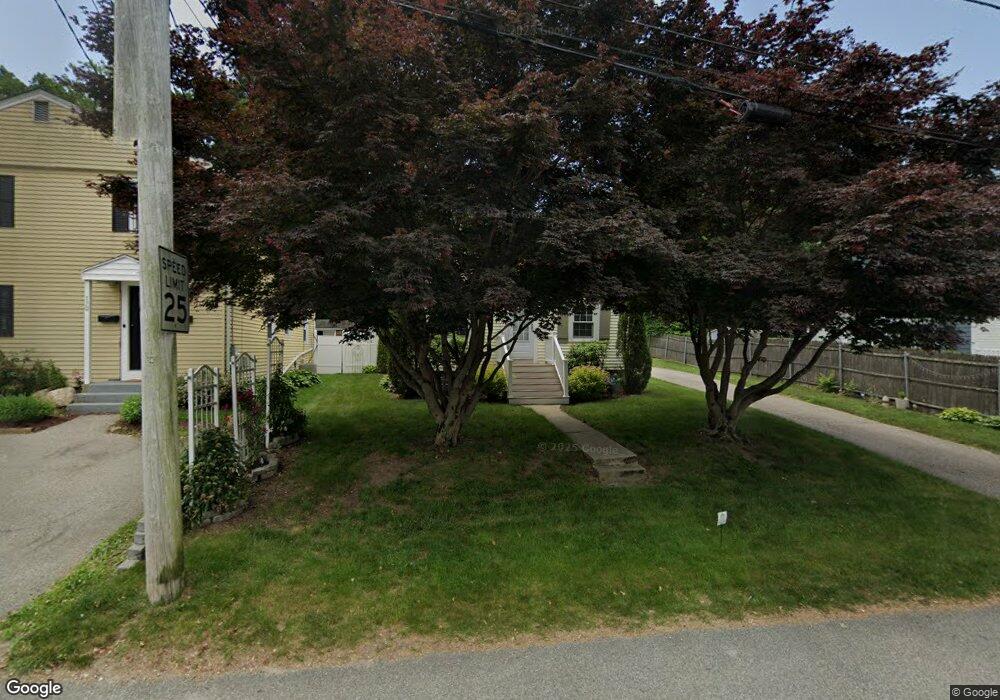
180 Lexington Ave Cranston, RI 02910
Eden Park NeighborhoodEstimated Value: $313,000 - $373,000
2
Beds
1
Bath
1,076
Sq Ft
$323/Sq Ft
Est. Value
About This Home
This home is located at 180 Lexington Ave, Cranston, RI 02910 and is currently estimated at $347,717, approximately $323 per square foot. 180 Lexington Ave is a home located in Providence County with nearby schools including Eden Park Elementary School, Park View Middle School, and Cranston High School East.
Ownership History
Date
Name
Owned For
Owner Type
Purchase Details
Closed on
Jun 14, 2021
Sold by
West Deborah A
Bought by
West Ryan A
Current Estimated Value
Purchase Details
Closed on
Nov 13, 2006
Sold by
Boutelle Stephen and Boutelle Donna
Bought by
West Deborah
Home Financials for this Owner
Home Financials are based on the most recent Mortgage that was taken out on this home.
Original Mortgage
$159,600
Interest Rate
6.31%
Mortgage Type
Purchase Money Mortgage
Purchase Details
Closed on
Aug 30, 2005
Sold by
Cook Marilyn E
Bought by
Boutelle Stephen T and Boutelle Donna E
Purchase Details
Closed on
Dec 5, 2003
Sold by
Tentoco Florentina
Bought by
Cook Marilyn
Purchase Details
Closed on
Nov 20, 2000
Sold by
Manning Paul
Bought by
Tentoco Teodoro and Tentoco Florentina
Create a Home Valuation Report for This Property
The Home Valuation Report is an in-depth analysis detailing your home's value as well as a comparison with similar homes in the area
Home Values in the Area
Average Home Value in this Area
Purchase History
| Date | Buyer | Sale Price | Title Company |
|---|---|---|---|
| West Ryan A | -- | None Available | |
| West Deborah | $200,000 | -- | |
| Boutelle Stephen T | $180,000 | -- | |
| Cook Marilyn | $145,000 | -- | |
| Tentoco Teodoro | $78,000 | -- |
Source: Public Records
Mortgage History
| Date | Status | Borrower | Loan Amount |
|---|---|---|---|
| Previous Owner | Tentoco Teodoro | $151,000 | |
| Previous Owner | Tentoco Teodoro | $159,600 | |
| Previous Owner | Tentoco Teodoro | $29,925 |
Source: Public Records
Tax History Compared to Growth
Tax History
| Year | Tax Paid | Tax Assessment Tax Assessment Total Assessment is a certain percentage of the fair market value that is determined by local assessors to be the total taxable value of land and additions on the property. | Land | Improvement |
|---|---|---|---|---|
| 2025 | $3,835 | $276,300 | $108,800 | $167,500 |
| 2024 | $3,760 | $276,300 | $108,800 | $167,500 |
| 2023 | $3,640 | $192,600 | $71,700 | $120,900 |
| 2022 | $3,565 | $192,600 | $71,700 | $120,900 |
| 2021 | $3,467 | $192,600 | $71,700 | $120,900 |
| 2020 | $3,334 | $160,500 | $68,200 | $92,300 |
| 2019 | $3,334 | $160,500 | $68,200 | $92,300 |
| 2018 | $3,257 | $160,500 | $68,200 | $92,300 |
| 2017 | $3,212 | $140,000 | $61,400 | $78,600 |
| 2016 | $3,143 | $140,000 | $61,400 | $78,600 |
| 2015 | $3,143 | $140,000 | $61,400 | $78,600 |
| 2014 | $3,214 | $140,700 | $61,400 | $79,300 |
Source: Public Records
Map
Nearby Homes
- 140 Concord Ave
- 36 Blackamore Ave
- 12 Stevens Rd
- 483 Pontiac Ave
- 130 Wollaston St
- 18 Glenwood Ave
- 129 Wollaston St
- 51 Norfolk St
- 115 Norfolk St
- 1 Rolfe Square
- 638 Pontiac Ave
- 75 High School Ave
- 26 Keith Ave
- 55 Columbus Blvd
- 132 Fordson Ave Unit 12
- 46 Roslyn Ave
- 140 Eldridge St
- 124 Clarence St
- 113 Fordson Ave
- 74 Leslie St
- 170 Lexington Ave
- 182 Lexington Ave
- 166 Lexington Ave
- 143 Blackamore Ave
- 143 Blackamore Ave Unit 2
- 137 Blackamore Ave
- 186 Lexington Ave
- 162 Lexington Ave
- 131 Blackamore Ave
- 149 Blackamore Ave
- 149 Blackamore Ave Unit 1
- 173 Lexington Ave
- 167 Lexington Ave
- 158 Lexington Ave
- 153 Blackamore Ave
- 165 Lexington Ave
- 127 Blackamore Ave
- 195 Concord Ave
- 192 Lexington Ave
- 186 Concord Ave Unit 186