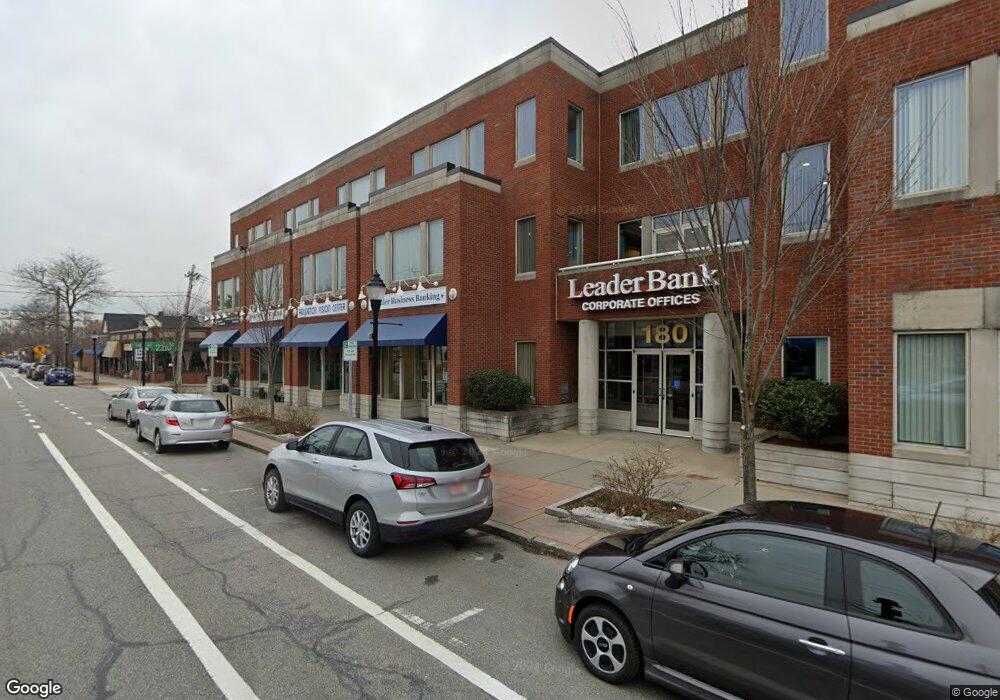
180 Massachusetts Ave Unit 101-C Arlington, MA 02474
East Arlington NeighborhoodEstimated Value: $987,682
--
Bed
1
Bath
1,280
Sq Ft
$772/Sq Ft
Est. Value
About This Home
This home is located at 180 Massachusetts Ave Unit 101-C, Arlington, MA 02474 and is currently estimated at $987,682, approximately $771 per square foot. 180 Massachusetts Ave Unit 101-C is a home located in Middlesex County with nearby schools including Hardy Elementary School, Thompson School, and Ottoson Middle School.
Ownership History
Date
Name
Owned For
Owner Type
Purchase Details
Closed on
Jan 29, 2020
Sold by
Rochon Lilliana
Bought by
Mkk Llc
Current Estimated Value
Home Financials for this Owner
Home Financials are based on the most recent Mortgage that was taken out on this home.
Original Mortgage
$175,000
Outstanding Balance
$155,244
Interest Rate
3.7%
Mortgage Type
New Conventional
Estimated Equity
$832,438
Purchase Details
Closed on
Jun 10, 1994
Sold by
Petras Nickolaos V
Bought by
Bank Five For Svgs and Fdic
Purchase Details
Closed on
Jun 3, 1991
Sold by
Paisley Corp
Bought by
Rochon Liliana
Home Financials for this Owner
Home Financials are based on the most recent Mortgage that was taken out on this home.
Original Mortgage
$184,960
Interest Rate
9.35%
Mortgage Type
Commercial
Create a Home Valuation Report for This Property
The Home Valuation Report is an in-depth analysis detailing your home's value as well as a comparison with similar homes in the area
Home Values in the Area
Average Home Value in this Area
Purchase History
| Date | Buyer | Sale Price | Title Company |
|---|---|---|---|
| Mkk Llc | -- | None Available | |
| Mkk Llc | $630,000 | None Available | |
| Bank Five For Svgs | $87,363 | -- | |
| Rochon Liliana | $231,200 | -- |
Source: Public Records
Mortgage History
| Date | Status | Borrower | Loan Amount |
|---|---|---|---|
| Open | Mkk Llc | $175,000 | |
| Closed | Mkk Llc | $175,000 | |
| Previous Owner | Rochon Liliana | $184,960 |
Source: Public Records
Tax History Compared to Growth
Tax History
| Year | Tax Paid | Tax Assessment Tax Assessment Total Assessment is a certain percentage of the fair market value that is determined by local assessors to be the total taxable value of land and additions on the property. | Land | Improvement |
|---|---|---|---|---|
| 2025 | $6,532 | $606,500 | $0 | $606,500 |
| 2024 | $6,194 | $584,900 | $0 | $584,900 |
| 2023 | $6,557 | $584,900 | $0 | $584,900 |
| 2022 | $6,426 | $562,700 | $0 | $562,700 |
| 2021 | $6,288 | $554,500 | $0 | $554,500 |
| 2020 | $4,559 | $412,200 | $0 | $412,200 |
| 2019 | $4,457 | $395,800 | $0 | $395,800 |
| 2018 | $2,904 | $239,400 | $0 | $239,400 |
| 2017 | $2,844 | $226,400 | $0 | $226,400 |
| 2016 | $2,898 | $226,400 | $0 | $226,400 |
| 2015 | $2,980 | $219,900 | $0 | $219,900 |
Source: Public Records
Map
Nearby Homes
- 215 Massachusetts Ave Unit 19 (34)
- 230 Massachusetts Ave Unit 6
- 128 Thorndike St Unit 2
- 137-139 Thorndike St Unit 2
- 3 Seagrave Rd
- 22 Hamilton Rd Unit 206
- 18 Belknap St Unit 2
- 18 Belknap St Unit 1
- 57 Garrison Ave
- 23 Brookford St
- 23 Brookford St Unit 2
- 23 Brookford St Unit 1
- 25-27 Adams St
- 31 Mott St Unit 31A
- 42-44 Warren St Unit 42
- 19 Cottage Park Ave
- 6 Hamilton Rd Unit 6
- 34 Belknap St
- 69 Clarendon Ave Unit A
- 127 Harvey St
- 180 Massachusetts Ave
- 5 Melrose St
- 5 Melrose St Unit 7
- 7 Melrose St
- 8 Egerton Rd Unit 8
- 6 Egerton Rd Unit 6
- 150 Massachusetts Ave
- 9 Melrose St Unit 11
- 148 Massachusetts Ave
- 12 Egerton Rd
- 10 Egerton Rd
- 97 Massachusetts Ave Unit 3
- 14 Egerton Rd Unit 16
- 13 Melrose St Unit 15
- 11 Melrose St Unit 11
- 10 Melrose St Unit 12
- 148 Mass Ave
- 155 Massachusetts Ave Unit 1-1
- 155 Massachusetts Ave Unit 4
- 155 Massachusetts Ave Unit 7