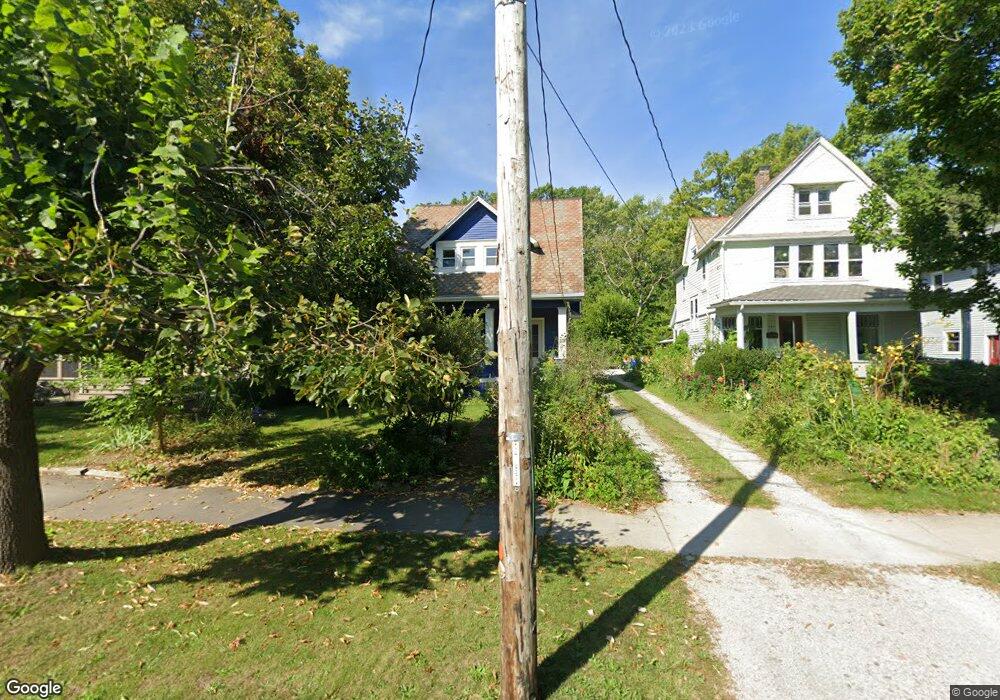
180 N Main St Oberlin, OH 44074
Estimated Value: $173,190 - $240,000
3
Beds
1
Bath
1,396
Sq Ft
$149/Sq Ft
Est. Value
About This Home
This home is located at 180 N Main St, Oberlin, OH 44074 and is currently estimated at $207,548, approximately $148 per square foot. 180 N Main St is a home located in Lorain County with nearby schools including Oberlin Elementary School, Prospect Elementary School, and Langston Middle School.
Ownership History
Date
Name
Owned For
Owner Type
Purchase Details
Closed on
Apr 9, 2004
Sold by
Cline H Jennifer
Bought by
Blissman M Elizabeth
Current Estimated Value
Home Financials for this Owner
Home Financials are based on the most recent Mortgage that was taken out on this home.
Original Mortgage
$126,200
Outstanding Balance
$59,388
Interest Rate
5.66%
Mortgage Type
Purchase Money Mortgage
Estimated Equity
$148,160
Create a Home Valuation Report for This Property
The Home Valuation Report is an in-depth analysis detailing your home's value as well as a comparison with similar homes in the area
Home Values in the Area
Average Home Value in this Area
Purchase History
| Date | Buyer | Sale Price | Title Company |
|---|---|---|---|
| Blissman M Elizabeth | $148,500 | Real Living Title Agency Ltd |
Source: Public Records
Mortgage History
| Date | Status | Borrower | Loan Amount |
|---|---|---|---|
| Open | Blissman M Elizabeth | $126,200 |
Source: Public Records
Tax History
| Year | Tax Paid | Tax Assessment Tax Assessment Total Assessment is a certain percentage of the fair market value that is determined by local assessors to be the total taxable value of land and additions on the property. | Land | Improvement |
|---|---|---|---|---|
| 2024 | $2,512 | $50,383 | $5,215 | $45,168 |
| 2023 | $2,689 | $48,668 | $3,927 | $44,741 |
| 2022 | $2,618 | $48,668 | $3,927 | $44,741 |
| 2021 | $2,612 | $48,668 | $3,927 | $44,741 |
| 2020 | $2,353 | $41,210 | $3,330 | $37,880 |
| 2019 | $2,322 | $41,210 | $3,330 | $37,880 |
| 2018 | $2,275 | $41,210 | $3,330 | $37,880 |
| 2017 | $2,213 | $40,320 | $5,300 | $35,020 |
| 2016 | $2,235 | $40,320 | $5,300 | $35,020 |
| 2015 | $2,238 | $40,320 | $5,300 | $35,020 |
| 2014 | $2,164 | $38,040 | $5,000 | $33,040 |
| 2013 | $2,127 | $38,040 | $5,000 | $33,040 |
Source: Public Records
Map
Nearby Homes
- 216 N Main St
- 230 N Main St
- 27 Union St
- 258 N Pleasant St
- 55 E College St Unit 212
- 89 S Professor St
- 215 W College St
- 252 W College St
- 123 S Professor St
- 0 S Park St
- 149 Morgan St
- 147 Morgan St
- 340 Edgemeer Place
- 177 Sumner St
- 95 Shipherd Cir
- 441 E College St
- 187 Shipherd Cir
- 32 W Lincoln St
- VL E Hamilton St
- 182 E Hamilton St
Your Personal Tour Guide
Ask me questions while you tour the home.