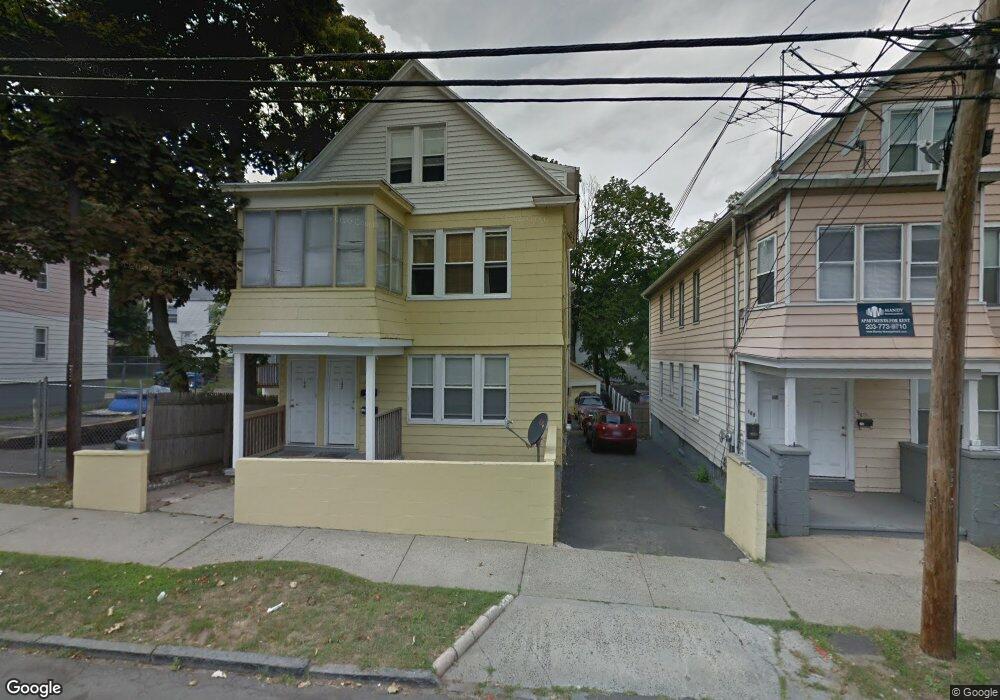
180 Quinnipiac Ave New Haven, CT 06513
Fair Haven Heights NeighborhoodEstimated Value: $299,000 - $429,000
8
Beds
2
Baths
2,707
Sq Ft
$130/Sq Ft
Est. Value
About This Home
This home is located at 180 Quinnipiac Ave, New Haven, CT 06513 and is currently estimated at $352,072, approximately $130 per square foot. 180 Quinnipiac Ave is a home located in New Haven County with nearby schools including Ross Woodward, St Francis & St Rose Of Lima School, and Cold Spring School.
Ownership History
Date
Name
Owned For
Owner Type
Purchase Details
Closed on
Aug 8, 2023
Sold by
Daisy Duke Llc
Bought by
Hotchkiss Maura L
Current Estimated Value
Purchase Details
Closed on
Apr 16, 2013
Sold by
Hotchkiss Maura L
Bought by
Daisy Duke Llc and Hotchkiss
Purchase Details
Closed on
Feb 8, 2011
Sold by
Hotchkiss Maura
Bought by
Daisy Duke Llc
Purchase Details
Closed on
Jun 24, 2009
Sold by
1375 Chapel St Assoc L
Bought by
Hotchkiss Maura
Purchase Details
Closed on
Jun 1, 2009
Sold by
Deutsche Bank Natl T C
Bought by
Steinbach Michael
Purchase Details
Closed on
Dec 15, 2008
Sold by
Rodriguez Marco and Deutsche Bank Natl T C
Bought by
Deutsche Bank Natl T C
Purchase Details
Closed on
Sep 23, 2005
Sold by
Cornero Jose
Bought by
Rodriguez Mario A
Purchase Details
Closed on
Jan 13, 1999
Sold by
Gambardella Andrew A and Gambardella Angela R
Bought by
Cornejo Jose
Create a Home Valuation Report for This Property
The Home Valuation Report is an in-depth analysis detailing your home's value as well as a comparison with similar homes in the area
Home Values in the Area
Average Home Value in this Area
Purchase History
| Date | Buyer | Sale Price | Title Company |
|---|---|---|---|
| Hotchkiss Maura L | -- | None Available | |
| Daisy Duke Llc | -- | -- | |
| Hotchkiss Maura L | -- | -- | |
| Daisy Duke Llc | -- | -- | |
| Hotchkiss Maura | $100,000 | -- | |
| Steinbach Michael | $72,900 | -- | |
| Deutsche Bank Natl T C | -- | -- | |
| Rodriguez Mario A | $280,000 | -- | |
| Cornejo Jose | $76,800 | -- |
Source: Public Records
Mortgage History
| Date | Status | Borrower | Loan Amount |
|---|---|---|---|
| Previous Owner | Cornejo Jose | $150,000 | |
| Previous Owner | Cornejo Jose | $150,000 |
Source: Public Records
Tax History Compared to Growth
Tax History
| Year | Tax Paid | Tax Assessment Tax Assessment Total Assessment is a certain percentage of the fair market value that is determined by local assessors to be the total taxable value of land and additions on the property. | Land | Improvement |
|---|---|---|---|---|
| 2025 | $6,556 | $166,390 | $39,480 | $126,910 |
| 2024 | $6,406 | $166,390 | $39,480 | $126,910 |
| 2023 | $6,190 | $166,390 | $39,480 | $126,910 |
| 2022 | $6,614 | $166,390 | $39,480 | $126,910 |
| 2021 | $4,878 | $111,160 | $25,830 | $85,330 |
| 2020 | $4,878 | $111,160 | $25,830 | $85,330 |
| 2019 | $4,778 | $111,160 | $25,830 | $85,330 |
| 2018 | $4,778 | $111,160 | $25,830 | $85,330 |
| 2017 | $4,300 | $111,160 | $25,830 | $85,330 |
| 2016 | $3,979 | $95,760 | $24,430 | $71,330 |
| 2015 | $3,979 | $95,760 | $24,430 | $71,330 |
| 2014 | $3,979 | $95,760 | $24,430 | $71,330 |
Source: Public Records
Map
Nearby Homes
- 172 Quinnipiac Ave
- 28 Farren Ave
- 98 Quinnipiac Ave
- 190 Farren Ave
- 193 Farren Ave
- 196 Farren Ave
- 74 Milton St
- 12 E Ferry St
- 225 Fulton Terrace
- 20 Ashland Place
- 95 Lenox St Unit L
- 121 Lexington Ave Unit 21
- 334 Prospect Ave Unit 334
- 1 Front St Unit 1 Kel
- 33 Chapel St
- 1117 Townsend Ave
- 32 E Pearl St
- 111 Chapel St
- 43 E Pearl St
- 8 Front St Unit D
- 184 Quinnipiac Ave
- 168 Quinnipiac Ave
- 188 Quinnipiac Ave
- 164 Quinnipiac Ave
- 164 Quinnipiac Ave Unit 2
- 192 Quinnipiac Ave
- 53 Farren Ave
- 51 Farren Ave
- 51 Farren Ave Unit 3
- 51 Farren Ave Unit 2
- 160 Quinnipiac Ave
- 160 Quinnipiac Ave Unit 2
- 67 Farren Ave
- 196 Quinnipiac Ave
- 185 Quinnipiac Ave Unit R
- 185 Quinnipiac Ave Unit 1R
- 185 Quinnipiac Ave
- 195 Quinnipiac Ave Unit 1 L
- 195 Quinnipiac Ave
- 69 Farren Ave