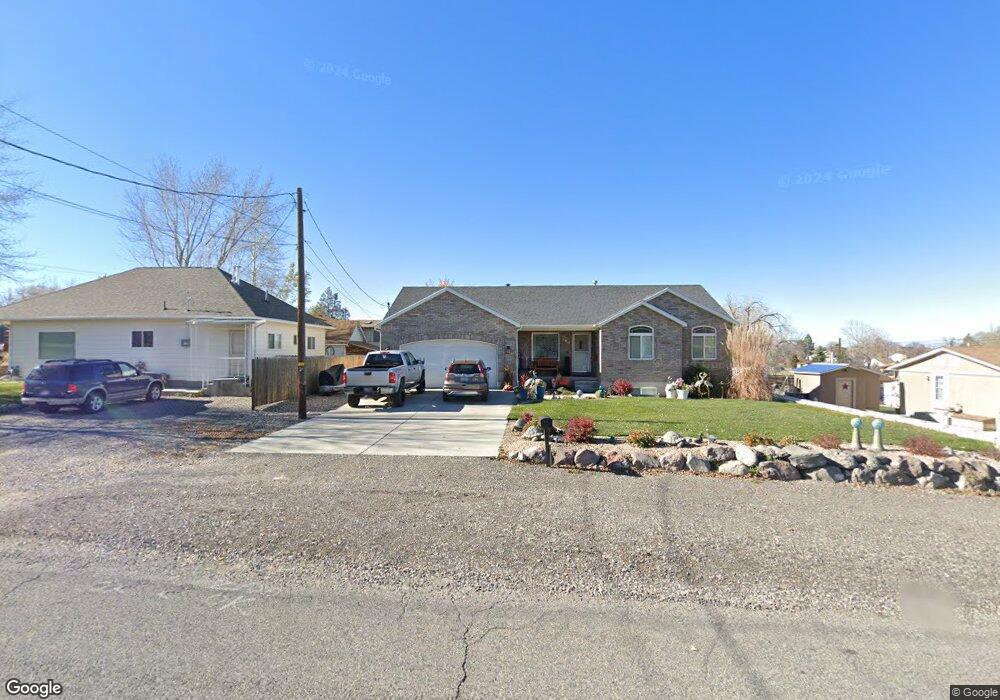
180 S 200 E Santaquin, UT 84655
Estimated Value: $472,000 - $532,000
3
Beds
3
Baths
2,750
Sq Ft
$184/Sq Ft
Est. Value
About This Home
This home is located at 180 S 200 E, Santaquin, UT 84655 and is currently estimated at $505,629, approximately $183 per square foot. 180 S 200 E is a home located in Utah County with nearby schools including Santaquin Elementary School, Payson Junior High School, and Mt. Nebo Middle.
Ownership History
Date
Name
Owned For
Owner Type
Purchase Details
Closed on
Mar 29, 2023
Sold by
Jones Ron
Bought by
Gayla F Wagers Living Trust
Current Estimated Value
Purchase Details
Closed on
Sep 9, 2021
Sold by
Benson Debbie M and The Debbie Mae Benson Trust
Bought by
Jones Ron and Wagers Gayla
Home Financials for this Owner
Home Financials are based on the most recent Mortgage that was taken out on this home.
Original Mortgage
$248,000
Interest Rate
2.8%
Mortgage Type
New Conventional
Purchase Details
Closed on
Jan 30, 2020
Sold by
Benson Debbie M
Bought by
Benson Debbie M and Debbie Mae Benson Trust
Purchase Details
Closed on
Feb 11, 2005
Sold by
Pack Bradley P and Pack Janet M
Bought by
Abbott Teresa Ladonna
Create a Home Valuation Report for This Property
The Home Valuation Report is an in-depth analysis detailing your home's value as well as a comparison with similar homes in the area
Home Values in the Area
Average Home Value in this Area
Purchase History
| Date | Buyer | Sale Price | Title Company |
|---|---|---|---|
| Gayla F Wagers Living Trust | -- | -- | |
| Jones Ron | -- | Inwest Title Orem | |
| Benson Debbie M | -- | None Available | |
| Abbott Teresa Ladonna | -- | Title West Title Company |
Source: Public Records
Mortgage History
| Date | Status | Borrower | Loan Amount |
|---|---|---|---|
| Previous Owner | Jones Ron | $248,000 |
Source: Public Records
Tax History
| Year | Tax Paid | Tax Assessment Tax Assessment Total Assessment is a certain percentage of the fair market value that is determined by local assessors to be the total taxable value of land and additions on the property. | Land | Improvement |
|---|---|---|---|---|
| 2025 | $2,308 | $251,185 | -- | -- |
| 2024 | $2,308 | $229,845 | $0 | $0 |
| 2023 | $2,410 | $240,790 | $0 | $0 |
| 2022 | $2,286 | $235,565 | $0 | $0 |
| 2021 | $1,995 | $318,700 | $67,800 | $250,900 |
| 2020 | $1,918 | $296,800 | $59,000 | $237,800 |
| 2019 | $1,658 | $262,500 | $55,700 | $206,800 |
| 2018 | $1,539 | $232,200 | $52,400 | $179,800 |
| 2017 | $1,492 | $120,285 | $0 | $0 |
| 2016 | $1,431 | $113,080 | $0 | $0 |
| 2015 | $1,350 | $104,610 | $0 | $0 |
| 2014 | $1,257 | $97,240 | $0 | $0 |
Source: Public Records
Map
Nearby Homes
- 185 E 200 S
- 161 E 200 S
- 170 S 200 E
- 1270 E 200 S Unit 101F
- 1271 E 200 S Unit OS107F
- 1270 E 200 S
- 1271 E 200 S
- 158 S 200 E
- 183 S 200 E
- 159 E 200 S
- 186 E 200 S
- 191 S 200 E
- 174 E 200 S
- 213 S 200 E
- 141 S 200 E
- 162 E 200 S
- 180 E 100 S
- 1306 S Salisbury Ct Unit 573
- 1329 S Salisbury Ct Unit 577
- 1317 S Salisbury Ct Unit 576
Your Personal Tour Guide
Ask me questions while you tour the home.