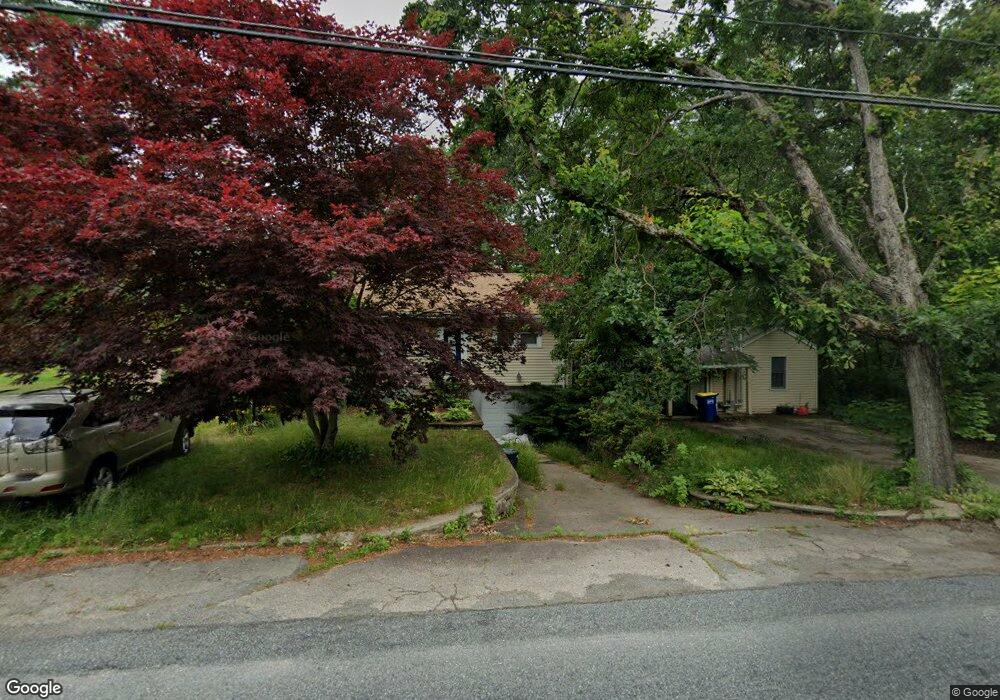
180 Union St East Bridgewater, MA 02333
Estimated Value: $542,290 - $654,000
3
Beds
3
Baths
1,776
Sq Ft
$332/Sq Ft
Est. Value
About This Home
This home is located at 180 Union St, East Bridgewater, MA 02333 and is currently estimated at $588,823, approximately $331 per square foot. 180 Union St is a home located in Plymouth County with nearby schools including Central Elementary School, Gordon W Mitchell Middle School, and East Bridgewater Jr./Sr. High School.
Ownership History
Date
Name
Owned For
Owner Type
Purchase Details
Closed on
Apr 16, 2004
Sold by
Crawford Catherine A
Bought by
Ross Mary N and Ross Donald E
Current Estimated Value
Home Financials for this Owner
Home Financials are based on the most recent Mortgage that was taken out on this home.
Original Mortgage
$308,750
Interest Rate
5.58%
Mortgage Type
Purchase Money Mortgage
Create a Home Valuation Report for This Property
The Home Valuation Report is an in-depth analysis detailing your home's value as well as a comparison with similar homes in the area
Home Values in the Area
Average Home Value in this Area
Purchase History
| Date | Buyer | Sale Price | Title Company |
|---|---|---|---|
| Ross Mary N | $325,000 | -- |
Source: Public Records
Mortgage History
| Date | Status | Borrower | Loan Amount |
|---|---|---|---|
| Open | Ross Mary N | $374,000 | |
| Closed | Ross Mary N | $364,500 | |
| Closed | Ross Mary N | $30,000 | |
| Closed | Ross Mary N | $308,750 |
Source: Public Records
Tax History Compared to Growth
Tax History
| Year | Tax Paid | Tax Assessment Tax Assessment Total Assessment is a certain percentage of the fair market value that is determined by local assessors to be the total taxable value of land and additions on the property. | Land | Improvement |
|---|---|---|---|---|
| 2025 | $5,251 | $384,100 | $179,900 | $204,200 |
| 2024 | $5,232 | $378,000 | $173,000 | $205,000 |
| 2023 | $5,390 | $373,000 | $173,000 | $200,000 |
| 2022 | $5,441 | $348,800 | $157,300 | $191,500 |
| 2021 | $8,268 | $308,300 | $151,200 | $157,100 |
| 2020 | $8,079 | $299,400 | $145,400 | $154,000 |
| 2019 | $8,059 | $288,400 | $138,900 | $149,500 |
| 2018 | $4,808 | $267,700 | $138,900 | $128,800 |
| 2017 | $12,108 | $257,400 | $132,500 | $124,900 |
| 2016 | $4,633 | $255,100 | $132,500 | $122,600 |
| 2015 | $4,543 | $255,800 | $131,600 | $124,200 |
| 2014 | $4,400 | $253,300 | $128,800 | $124,500 |
Source: Public Records
Map
Nearby Homes
- 11 Harmony Crossing
- 41 Bedford St
- 71 Church St
- 11 Willow Ave
- 9 Hemlock Dr
- 14 Mountain Ash Rd
- 282 Spring St
- 261 Plymouth St
- 585 N Bedford St
- 611 N Bedford St
- 416 Highland St
- 1 Simmons Place
- 78 Crystal Water Dr
- 407 W Union St
- 446 Elm St
- 217 Crystal Water Dr
- 505 N Central St
- 182 Crystal Water Dr Unit 182
- 936 Central St
- 455 Plymouth St