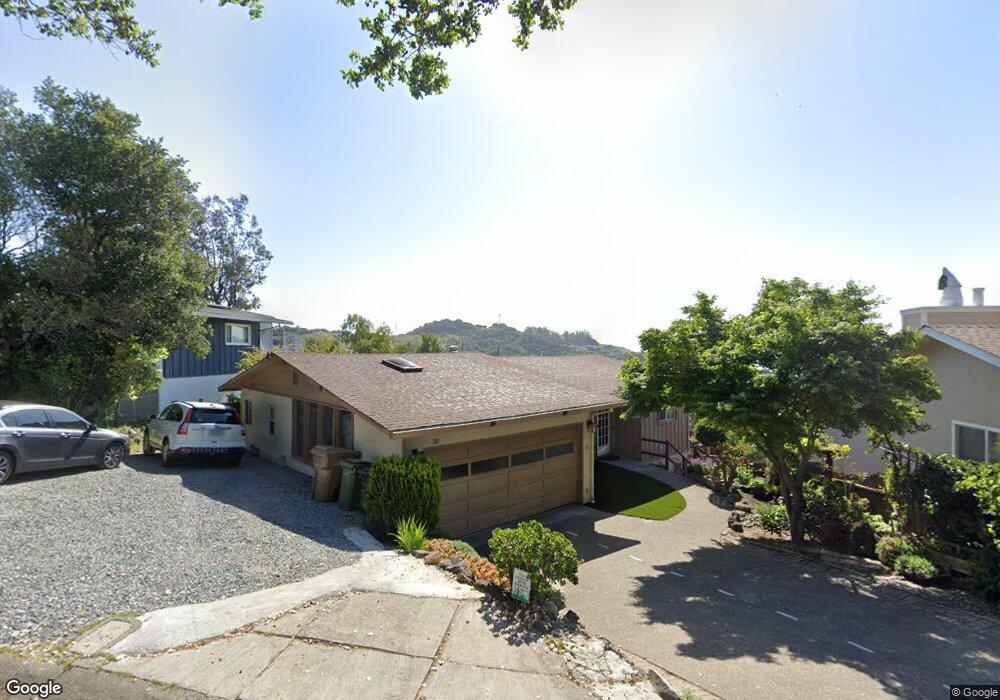
180 Via la Cumbre Greenbrae, CA 94904
Greenbrae/Larkspur Landing NeighborhoodEstimated Value: $1,376,000 - $1,759,000
3
Beds
3
Baths
1,830
Sq Ft
$879/Sq Ft
Est. Value
About This Home
This home is located at 180 Via la Cumbre, Greenbrae, CA 94904 and is currently estimated at $1,608,200, approximately $878 per square foot. 180 Via la Cumbre is a home located in Marin County with nearby schools including Anthony G. Bacich Elementary School, Adaline E. Kent Middle School, and Redwood High School.
Ownership History
Date
Name
Owned For
Owner Type
Purchase Details
Closed on
May 1, 2020
Sold by
Joun Yong Pong and Joun Chun M
Bought by
Joun Yong Pong and Joun Chun Mea
Current Estimated Value
Purchase Details
Closed on
Dec 15, 2004
Sold by
Joun Yong Pong and Joun Chun M
Bought by
Joun Yong Pong and Joun Chun M
Purchase Details
Closed on
May 28, 2004
Sold by
Jung Yung K and Jung Seoung H
Bought by
Joun Yong Pong and Joun Chun M
Home Financials for this Owner
Home Financials are based on the most recent Mortgage that was taken out on this home.
Original Mortgage
$400,000
Outstanding Balance
$190,534
Interest Rate
5.62%
Mortgage Type
Purchase Money Mortgage
Estimated Equity
$1,417,666
Purchase Details
Closed on
Sep 27, 1996
Sold by
William Hobin
Bought by
Jung Yung K and Jung Seoung H
Home Financials for this Owner
Home Financials are based on the most recent Mortgage that was taken out on this home.
Original Mortgage
$202,300
Interest Rate
7.95%
Create a Home Valuation Report for This Property
The Home Valuation Report is an in-depth analysis detailing your home's value as well as a comparison with similar homes in the area
Home Values in the Area
Average Home Value in this Area
Purchase History
| Date | Buyer | Sale Price | Title Company |
|---|---|---|---|
| Joun Yong Pong | -- | None Available | |
| Joun Yong Pong | $75,000 | -- | |
| Joun Yong Pong | $550,000 | Fidelity National Title | |
| Jung Yung K | $289,000 | First American Title Co |
Source: Public Records
Mortgage History
| Date | Status | Borrower | Loan Amount |
|---|---|---|---|
| Open | Joun Yong Pong | $400,000 | |
| Closed | Jung Yung K | $202,300 |
Source: Public Records
Tax History Compared to Growth
Tax History
| Year | Tax Paid | Tax Assessment Tax Assessment Total Assessment is a certain percentage of the fair market value that is determined by local assessors to be the total taxable value of land and additions on the property. | Land | Improvement |
|---|---|---|---|---|
| 2025 | $13,378 | $842,505 | $563,098 | $279,407 |
| 2024 | $13,378 | $825,990 | $552,060 | $273,930 |
| 2023 | $13,112 | $809,796 | $541,236 | $268,560 |
| 2022 | $12,986 | $793,921 | $530,626 | $263,295 |
| 2021 | $12,730 | $778,357 | $520,224 | $258,133 |
| 2020 | $12,532 | $770,380 | $514,892 | $255,488 |
| 2019 | $12,124 | $755,278 | $504,798 | $250,480 |
| 2018 | $11,709 | $740,471 | $494,902 | $245,569 |
| 2017 | $11,014 | $725,954 | $485,200 | $240,754 |
| 2016 | $10,639 | $711,723 | $475,688 | $236,035 |
| 2015 | $10,567 | $701,035 | $468,544 | $232,491 |
| 2014 | $9,994 | $687,305 | $459,368 | $227,937 |
Source: Public Records
Map
Nearby Homes
- 370 Via la Cumbre
- 325 Via la Cumbre
- 124 Tiburon Blvd
- 1 Drakes View Cir
- 66 La Cuesta Dr
- 47 Elizabeth Cir
- 2130 Redwood Hwy Unit F5
- 2130 Redwood Hwy Unit G6
- 2130 Redwood Hwy Unit D2
- 148 Auburn St
- 254 Riviera Cir
- 202 Riviera Cir
- 334 Riviera Cir
- 35 Hillview Ave
- 28 Hillview Ave
- 110 Auburn St
- 10 Hazel Ct
- 72 Lucky Dr
- 290 Via Casitas Unit 206
- 175 Upper Via Casitas Unit 2
- 192 Via la Cumbre
- 172 Via La Cumbre None
- 200 Via la Cumbre
- 168 Via La Cumbre Unkn
- 168 Via la Cumbre
- 208 Vía La Cumbre
- 208 Via la Cumbre
- 208 Via La Cumbre Unkn
- 156 Via la Cumbre
- 175 Via la Cumbre
- 181 Via la Cumbre
- 163 Via la Cumbre
- 193 Via la Cumbre
- 216 Via la Cumbre
- 157 Via la Cumbre
- 201 Via la Cumbre
- 148 Via La Cumbre Unkn
- 148 Via la Cumbre
- 209 Via la Cumbre