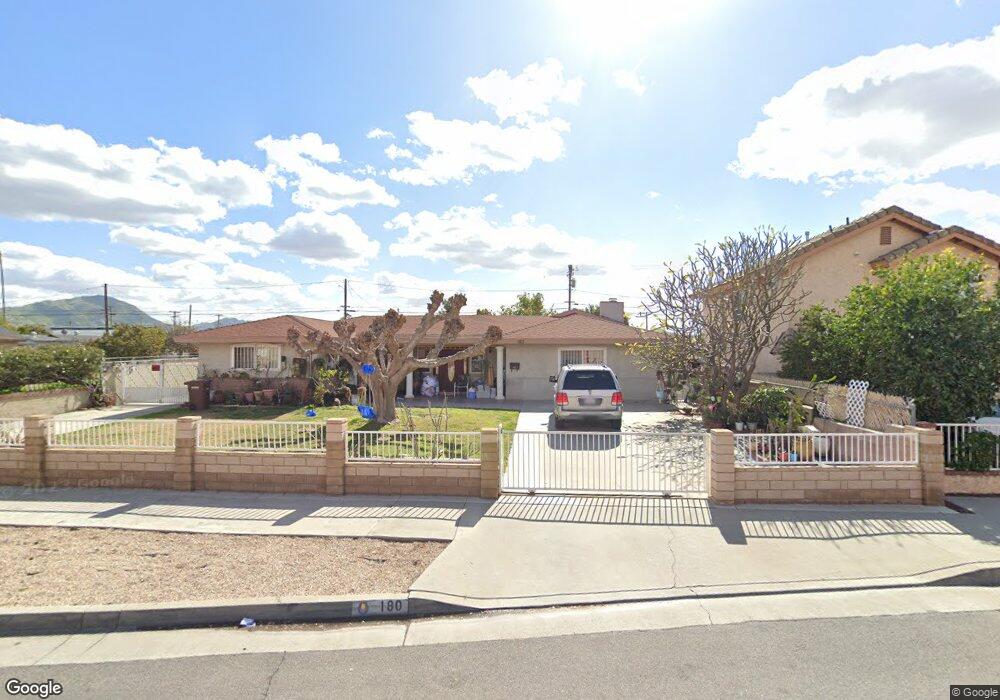
180 W N St Colton, CA 92324
Estimated Value: $504,000 - $666,000
3
Beds
2
Baths
1,879
Sq Ft
$292/Sq Ft
Est. Value
About This Home
This home is located at 180 W N St, Colton, CA 92324 and is currently estimated at $548,134, approximately $291 per square foot. 180 W N St is a home located in San Bernardino County with nearby schools including Paul Rogers Elementary School, Terrace Hills Middle School, and Grand Terrace High School.
Ownership History
Date
Name
Owned For
Owner Type
Purchase Details
Closed on
Oct 29, 1996
Sold by
Gutierrez Yolanda
Bought by
Venegas Jose and Venegas Griselda
Current Estimated Value
Home Financials for this Owner
Home Financials are based on the most recent Mortgage that was taken out on this home.
Original Mortgage
$90,250
Outstanding Balance
$8,714
Interest Rate
7.86%
Estimated Equity
$539,420
Purchase Details
Closed on
Mar 27, 1995
Sold by
Noriega Estela
Bought by
Gutierrez Roy and Gutierrez Yolanda
Create a Home Valuation Report for This Property
The Home Valuation Report is an in-depth analysis detailing your home's value as well as a comparison with similar homes in the area
Home Values in the Area
Average Home Value in this Area
Purchase History
| Date | Buyer | Sale Price | Title Company |
|---|---|---|---|
| Venegas Jose | $95,000 | Orange Coast Title | |
| Gutierrez Yolanda | -- | Orange Coast Title | |
| Gutierrez Roy | -- | World Title Company |
Source: Public Records
Mortgage History
| Date | Status | Borrower | Loan Amount |
|---|---|---|---|
| Open | Venegas Jose | $90,250 |
Source: Public Records
Tax History
| Year | Tax Paid | Tax Assessment Tax Assessment Total Assessment is a certain percentage of the fair market value that is determined by local assessors to be the total taxable value of land and additions on the property. | Land | Improvement |
|---|---|---|---|---|
| 2025 | $1,862 | $154,723 | $32,573 | $122,150 |
| 2024 | $1,775 | $151,689 | $31,934 | $119,755 |
| 2023 | $1,779 | $148,715 | $31,308 | $117,407 |
| 2022 | $1,752 | $145,799 | $30,694 | $115,105 |
| 2021 | $1,786 | $142,940 | $30,092 | $112,848 |
| 2020 | $1,792 | $141,474 | $29,783 | $111,691 |
| 2019 | $1,742 | $138,700 | $29,199 | $109,501 |
| 2018 | $1,713 | $135,980 | $28,626 | $107,354 |
| 2017 | $1,652 | $133,314 | $28,065 | $105,249 |
| 2016 | $1,691 | $130,700 | $27,515 | $103,185 |
| 2015 | $1,637 | $128,737 | $27,102 | $101,635 |
| 2014 | $1,579 | $126,215 | $26,571 | $99,644 |
Source: Public Records
Map
Nearby Homes
- 244 W N St
- 248 W N St
- 125 E O St
- 659 S 7th St
- 0 W O St
- 242 E M St
- 165 E O St
- 340 W Congress St
- 507 Villa Way
- 584 E H St Unit 1-11
- 1200 Jefferson Ln
- 472 E E St
- 845 N 9th St
- 841 E H St
- 845 E H St
- 1097 Santo Antonio Dr Unit 51
- 805 Valencia Dr
- 1077 Santo Antonio Dr Unit 15
- 1077 N La Cadena Dr
- 941 W F St
Your Personal Tour Guide
Ask me questions while you tour the home.