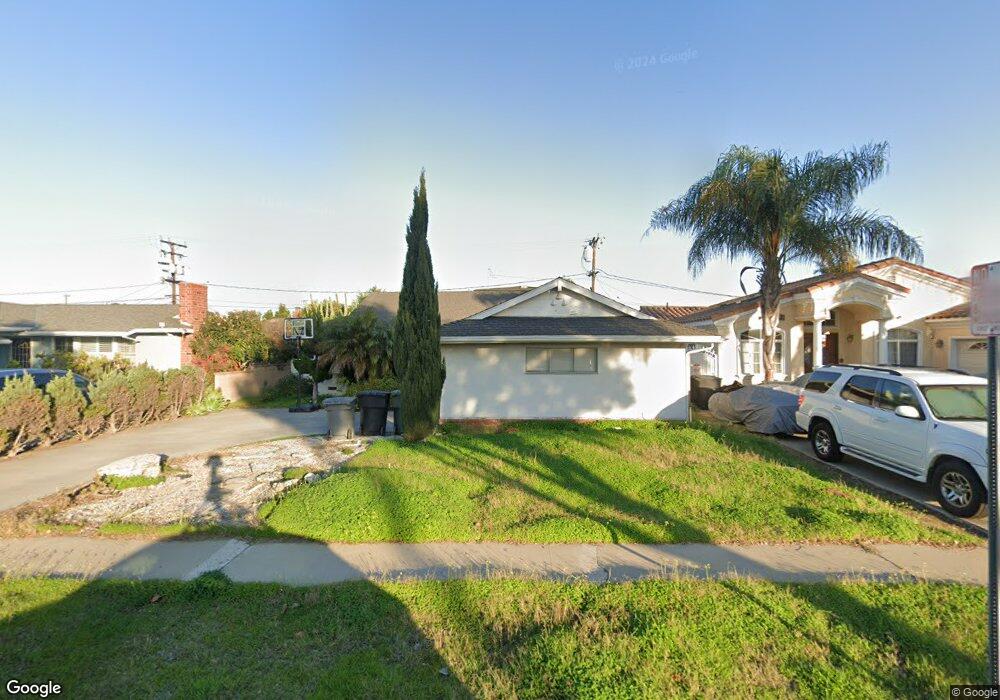
18000 Crenshaw Blvd Torrance, CA 90504
North Torrance NeighborhoodEstimated Value: $958,000 - $1,063,000
3
Beds
2
Baths
1,328
Sq Ft
$760/Sq Ft
Est. Value
About This Home
This home is located at 18000 Crenshaw Blvd, Torrance, CA 90504 and is currently estimated at $1,009,878, approximately $760 per square foot. 18000 Crenshaw Blvd is a home located in Los Angeles County with nearby schools including Arlington Elementary School, Casimir Middle School, and North High School.
Ownership History
Date
Name
Owned For
Owner Type
Purchase Details
Closed on
Sep 5, 2001
Sold by
Nakawake Tatsuya
Bought by
Nakawake Tatsuya
Current Estimated Value
Home Financials for this Owner
Home Financials are based on the most recent Mortgage that was taken out on this home.
Original Mortgage
$193,500
Interest Rate
7.05%
Purchase Details
Closed on
Mar 27, 2000
Sold by
Alpizar Maria Ester
Bought by
Alpizar George
Home Financials for this Owner
Home Financials are based on the most recent Mortgage that was taken out on this home.
Original Mortgage
$180,000
Interest Rate
8.24%
Mortgage Type
Purchase Money Mortgage
Purchase Details
Closed on
Mar 22, 2000
Sold by
Alpizer George
Bought by
Nakawake Tatsuya
Home Financials for this Owner
Home Financials are based on the most recent Mortgage that was taken out on this home.
Original Mortgage
$180,000
Interest Rate
8.24%
Mortgage Type
Purchase Money Mortgage
Create a Home Valuation Report for This Property
The Home Valuation Report is an in-depth analysis detailing your home's value as well as a comparison with similar homes in the area
Home Values in the Area
Average Home Value in this Area
Purchase History
| Date | Buyer | Sale Price | Title Company |
|---|---|---|---|
| Nakawake Tatsuya | -- | American Title Co | |
| Alpizar George | -- | Gateway Title | |
| Nakawake Tatsuya | $245,000 | Gateway Title Company |
Source: Public Records
Mortgage History
| Date | Status | Borrower | Loan Amount |
|---|---|---|---|
| Previous Owner | Nakawake Tatsuya | $193,500 | |
| Previous Owner | Alpizar George | $180,000 | |
| Previous Owner | Nakawake Tatsuya | $180,000 |
Source: Public Records
Tax History Compared to Growth
Tax History
| Year | Tax Paid | Tax Assessment Tax Assessment Total Assessment is a certain percentage of the fair market value that is determined by local assessors to be the total taxable value of land and additions on the property. | Land | Improvement |
|---|---|---|---|---|
| 2025 | $4,523 | $376,534 | $283,407 | $93,127 |
| 2024 | $4,523 | $369,151 | $277,850 | $91,301 |
| 2023 | $4,443 | $361,913 | $272,402 | $89,511 |
| 2022 | $4,385 | $354,817 | $267,061 | $87,756 |
| 2021 | $4,302 | $347,861 | $261,825 | $86,036 |
| 2019 | $4,181 | $337,545 | $254,060 | $83,485 |
| 2018 | $4,003 | $330,928 | $249,079 | $81,849 |
| 2016 | $3,820 | $318,080 | $239,408 | $78,672 |
| 2015 | $3,738 | $313,303 | $235,812 | $77,491 |
| 2014 | $3,648 | $307,167 | $231,193 | $75,974 |
Source: Public Records
Map
Nearby Homes
- 3151 W 182nd St
- 18403 Eriel Ave
- 18405 Delia Ave
- 2406 W 177th St
- 3349 W 183rd St
- 2321 W 184th St
- 18309 Faysmith Ave
- 17234 Ardath Ave
- 18249 Van Ness Ave
- 2527 Artesia Blvd Unit 67
- 18505 Van Ness Ave
- 3420 W 186th St
- 17508 Van Ness Ave
- 17302 Ermanita Ave
- 17033 Glenburn Ave
- 2007 W 180th Place
- 3482 W 171st St Unit 19
- 3717 W 182nd St
- 3615 W 187th St
- 16725 Elgar Ave
- 17928 Crenshaw Blvd
- 18004 Crenshaw Blvd
- 18005 Atkinson Ave
- 17924 Crenshaw Blvd
- 18001 Atkinson Ave
- 18009 Atkinson Ave
- 17923 Atkinson Ave
- 18015 Atkinson Ave
- 17920 Crenshaw Blvd
- 17919 Atkinson Ave
- 18021 Atkinson Ave
- 17915 Atkinson Ave
- 18025 Atkinson Ave
- 18001 Crenshaw Blvd Unit C
- 18001 Crenshaw Blvd
- 18003 Crenshaw Blvd Unit B
- 18003 Crenshaw Blvd
- 17925 Crenshaw Blvd
- 17910 Crenshaw Blvd
- 18006 Atkinson Ave