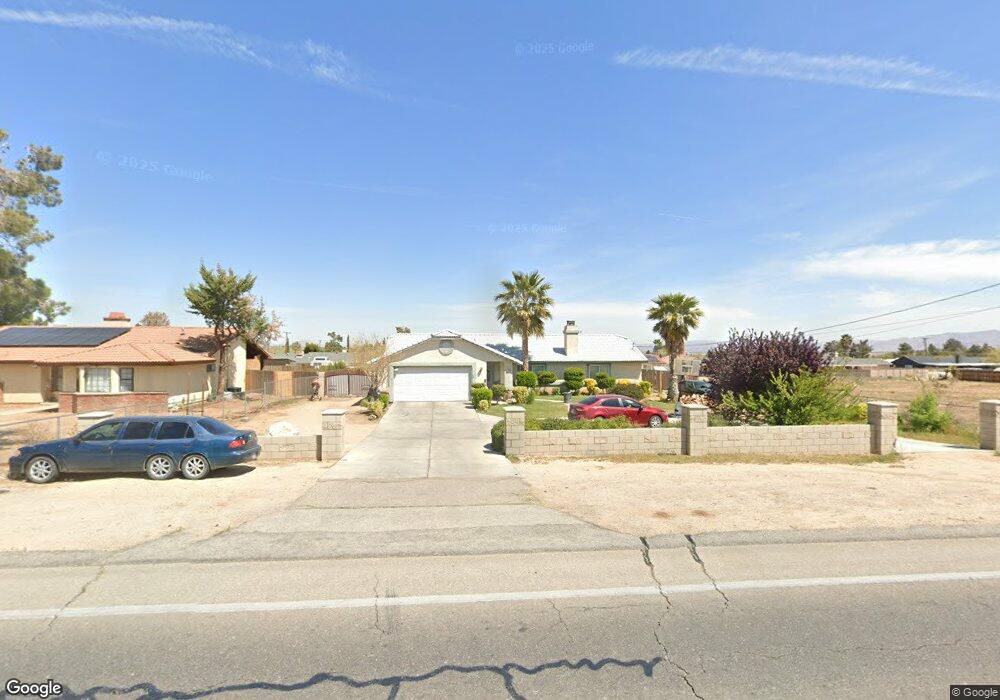
18000 Main St Hesperia, CA 92345
Estimated Value: $439,000 - $453,000
3
Beds
2
Baths
1,590
Sq Ft
$279/Sq Ft
Est. Value
About This Home
This home is located at 18000 Main St, Hesperia, CA 92345 and is currently estimated at $443,703, approximately $279 per square foot. 18000 Main St is a home located in San Bernardino County with nearby schools including Juniper Elementary School, Ranchero Middle School, and Sultana High School.
Ownership History
Date
Name
Owned For
Owner Type
Purchase Details
Closed on
Oct 28, 2009
Sold by
Soto Benigno Urias
Bought by
Soto Benigno Urias and Urias Maria Guadalupe
Current Estimated Value
Purchase Details
Closed on
Aug 20, 2009
Sold by
Urias Maria Guadalupe
Bought by
Soto Benigno Urias
Home Financials for this Owner
Home Financials are based on the most recent Mortgage that was taken out on this home.
Original Mortgage
$119,790
Interest Rate
4.83%
Mortgage Type
FHA
Purchase Details
Closed on
Jul 28, 2009
Sold by
Deutsche Bank National Trust Company
Bought by
Soto Benigno Urias
Home Financials for this Owner
Home Financials are based on the most recent Mortgage that was taken out on this home.
Original Mortgage
$119,790
Interest Rate
4.83%
Mortgage Type
FHA
Purchase Details
Closed on
Dec 11, 2008
Sold by
Dominguez Sarayt
Bought by
Deutsche Bank National Trust Company
Purchase Details
Closed on
Mar 24, 2006
Sold by
Dominguez Alejandro
Bought by
Dominguez Sarayt
Home Financials for this Owner
Home Financials are based on the most recent Mortgage that was taken out on this home.
Original Mortgage
$68,000
Interest Rate
6.2%
Mortgage Type
Stand Alone Second
Purchase Details
Closed on
Feb 28, 2006
Sold by
Monson Steven Anthony and Monson Sherry Lynn
Bought by
Dominguez Sarayt
Home Financials for this Owner
Home Financials are based on the most recent Mortgage that was taken out on this home.
Original Mortgage
$68,000
Interest Rate
6.2%
Mortgage Type
Stand Alone Second
Purchase Details
Closed on
May 18, 2004
Sold by
Bob Hill Construction Inc
Bought by
Monson Steven Anthony and Monson Sherry Lynn
Home Financials for this Owner
Home Financials are based on the most recent Mortgage that was taken out on this home.
Original Mortgage
$150,000
Interest Rate
6.75%
Mortgage Type
Purchase Money Mortgage
Purchase Details
Closed on
Feb 9, 2004
Sold by
Bob Hill Construction Inc
Bought by
Hill Robert and Hill Kimiko
Home Financials for this Owner
Home Financials are based on the most recent Mortgage that was taken out on this home.
Original Mortgage
$87,829
Interest Rate
5.61%
Mortgage Type
Purchase Money Mortgage
Purchase Details
Closed on
May 8, 2003
Sold by
Aguilar Jose R and Aguilar Gloria
Bought by
Bob Hill Construction Inc
Purchase Details
Closed on
Aug 8, 2000
Sold by
Ginsberg Gertrude Trust
Bought by
Aguilar Jose R and Aguilar Gloria
Create a Home Valuation Report for This Property
The Home Valuation Report is an in-depth analysis detailing your home's value as well as a comparison with similar homes in the area
Purchase History
| Date | Buyer | Sale Price | Title Company |
|---|---|---|---|
| Soto Benigno Urias | -- | Accommodation | |
| Soto Benigno Urias | -- | Lsi Title Company | |
| Soto Benigno Urias | $122,000 | Lsi Title Company | |
| Deutsche Bank National Trust Company | $178,500 | Accommodation | |
| Dominguez Sarayt | -- | Chicago Title Company | |
| Dominguez Sarayt | $340,000 | Chicago Title Company | |
| Monson Steven Anthony | $190,000 | Chicago Title Company | |
| Bob Hill Construction Inc | -- | Chicago Title Company | |
| Hill Robert | -- | Southland Title - Socal | |
| Bob Hill Construction Inc | $26,000 | Chicago Title Co | |
| Aguilar Jose R | $13,000 | Fidelity National Title Co |
Source: Public Records
Mortgage History
| Date | Status | Borrower | Loan Amount |
|---|---|---|---|
| Previous Owner | Soto Benigno Urias | $119,790 | |
| Previous Owner | Dominguez Sarayt | $68,000 | |
| Previous Owner | Dominguez Sarayt | $272,000 | |
| Previous Owner | Monson Steven Anthony | $150,000 | |
| Previous Owner | Hill Robert | $87,829 |
Source: Public Records
Tax History
| Year | Tax Paid | Tax Assessment Tax Assessment Total Assessment is a certain percentage of the fair market value that is determined by local assessors to be the total taxable value of land and additions on the property. | Land | Improvement |
|---|---|---|---|---|
| 2025 | $2,199 | $157,481 | $25,818 | $131,663 |
| 2024 | $2,137 | $154,393 | $25,312 | $129,081 |
| 2023 | $2,155 | $151,366 | $24,816 | $126,550 |
| 2022 | $1,954 | $148,398 | $24,329 | $124,069 |
| 2021 | $1,976 | $145,488 | $23,852 | $121,636 |
| 2020 | $2,586 | $143,996 | $23,607 | $120,389 |
| 2019 | $2,516 | $141,172 | $23,144 | $118,028 |
| 2018 | $2,115 | $138,404 | $22,690 | $115,714 |
| 2017 | $1,476 | $135,690 | $22,245 | $113,445 |
| 2016 | $1,444 | $133,030 | $21,809 | $111,221 |
| 2015 | -- | $131,031 | $21,481 | $109,550 |
| 2014 | $1,405 | $128,464 | $21,060 | $107,404 |
Source: Public Records
Map
Nearby Homes
- 9290 Buckthorn Ave
- 8960 Buckthorn Ave
- 17837 Sultana St
- 9341 Buckthorn Ave
- 17775 Sultana St
- 8878 Sabina Ave
- 18146 Orange St
- 17788 Buckthorn Ave
- 17600 Orange St
- 9321 Sabina Ave
- 9508 Buckthorn Ave
- 9472 Guava Ave
- 17482 Walnut St
- 39914350 49 Jacaranda Ave
- 18393 Orange St
- 0 Willow Ct
- 18186 Bangor Ave
- 18548 Main St
- 18425 Orange St
- 17434 Laurel St
Your Personal Tour Guide
Ask me questions while you tour the home.