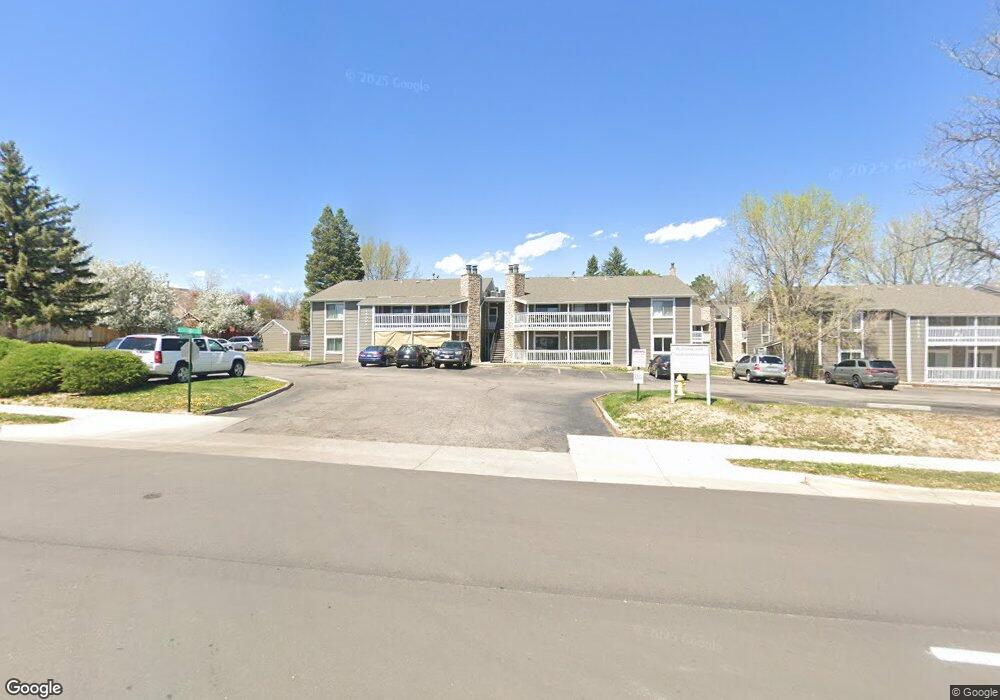
18001 E Kentucky Ave Unit 204 Aurora, CO 80017
Tollgate Overlook NeighborhoodEstimated Value: $236,952 - $256,000
3
Beds
2
Baths
1,177
Sq Ft
$208/Sq Ft
Est. Value
About This Home
This home is located at 18001 E Kentucky Ave Unit 204, Aurora, CO 80017 and is currently estimated at $244,988, approximately $208 per square foot. 18001 E Kentucky Ave Unit 204 is a home located in Arapahoe County with nearby schools including Arkansas Elementary School, Mrachek Middle School, and Gateway High School.
Ownership History
Date
Name
Owned For
Owner Type
Purchase Details
Closed on
Dec 20, 1996
Sold by
Hui Son Chu In and Hui Ok
Bought by
Miller Edward
Current Estimated Value
Home Financials for this Owner
Home Financials are based on the most recent Mortgage that was taken out on this home.
Original Mortgage
$56,542
Outstanding Balance
$5,696
Interest Rate
7.6%
Mortgage Type
FHA
Estimated Equity
$239,292
Purchase Details
Closed on
Nov 30, 1990
Sold by
Steinbeck Charles G and Steinbeck Sherry D
Bought by
Son Chu In Son Ok Hui
Purchase Details
Closed on
Sep 8, 1989
Sold by
Imperial Savings Assn
Bought by
Steinbeck Charles G and Steinbeck Sherry D
Purchase Details
Closed on
Jun 26, 1989
Sold by
Conversion Arapco
Bought by
Imperial Savings Assn
Purchase Details
Closed on
Jun 1, 1981
Sold by
Conversion Arapco
Bought by
Conversion Arapco
Purchase Details
Closed on
Jul 4, 1776
Bought by
Conversion Arapco
Create a Home Valuation Report for This Property
The Home Valuation Report is an in-depth analysis detailing your home's value as well as a comparison with similar homes in the area
Home Values in the Area
Average Home Value in this Area
Purchase History
| Date | Buyer | Sale Price | Title Company |
|---|---|---|---|
| Miller Edward | $57,500 | -- | |
| Son Chu In Son Ok Hui | -- | -- | |
| Steinbeck Charles G | -- | -- | |
| Imperial Savings Assn | -- | -- | |
| Conversion Arapco | -- | -- | |
| Conversion Arapco | -- | -- |
Source: Public Records
Mortgage History
| Date | Status | Borrower | Loan Amount |
|---|---|---|---|
| Open | Miller Edward | $56,542 |
Source: Public Records
Tax History Compared to Growth
Tax History
| Year | Tax Paid | Tax Assessment Tax Assessment Total Assessment is a certain percentage of the fair market value that is determined by local assessors to be the total taxable value of land and additions on the property. | Land | Improvement |
|---|---|---|---|---|
| 2024 | $861 | $15,967 | -- | -- |
| 2023 | $861 | $15,967 | $0 | $0 |
| 2022 | $633 | $12,608 | $0 | $0 |
| 2021 | $653 | $12,608 | $0 | $0 |
| 2020 | $644 | $12,363 | $0 | $0 |
| 2019 | $640 | $12,363 | $0 | $0 |
| 2018 | $496 | $9,374 | $0 | $0 |
| 2017 | $431 | $9,374 | $0 | $0 |
| 2016 | $308 | $6,567 | $0 | $0 |
| 2015 | $298 | $6,567 | $0 | $0 |
| 2014 | $173 | $3,685 | $0 | $0 |
| 2013 | -- | $4,800 | $0 | $0 |
Source: Public Records
Map
Nearby Homes
- 18064 E Ohio Ave Unit 104
- 18103 E Kentucky Ave Unit 203
- 18004 E Ohio Ave Unit 101
- 18003 E Ohio Ave Unit 102
- 18073 E Ohio Ave Unit 203
- 18033 E Ohio Ave Unit 201
- 18105 E Ohio Ave Unit 204
- 18043 E Ohio Ave Unit 202
- 18063 E Ohio Ave Unit 201
- 17714 E Ada Dr
- 18064 E Ford Place
- 18301 E Kepner Place Unit 106
- 908 S Walden Way Unit 201
- 904 S Walden Way Unit 204
- 906 S Walden St Unit 104
- 1006 S Waco Way
- 18391 E Kepner Place Unit 103
- 943 S Zeno Way Unit 102
- 922 S Walden St Unit 201
- 922 S Walden St Unit 101
- 18001 E Kentucky Ave Unit 203
- 18001 E Kentucky Ave Unit 202
- 18001 E Kentucky Ave Unit 201
- 18001 E Kentucky Ave Unit 104
- 18001 E Kentucky Ave Unit 103
- 18001 E Kentucky Ave Unit 102
- 18001 E Kentucky Ave Unit 101
- 18021 E Kentucky Ave Unit 204
- 18021 E Kentucky Ave Unit 203
- 18021 E Kentucky Ave Unit 202
- 18021 E Kentucky Ave Unit 201
- 18021 E Kentucky Ave Unit 104
- 18021 E Kentucky Ave Unit 103
- 18021 E Kentucky Ave Unit 102
- 18021 E Kentucky Ave Unit 101
- 18021 E Kentucky Ave
- 18021 E Kentucky Ave Unit 9203
- 18021 E Kentucky Ave Unit 9104
- 18051 E Kentucky Ave Unit 204
- 18051 E Kentucky Ave Unit 203