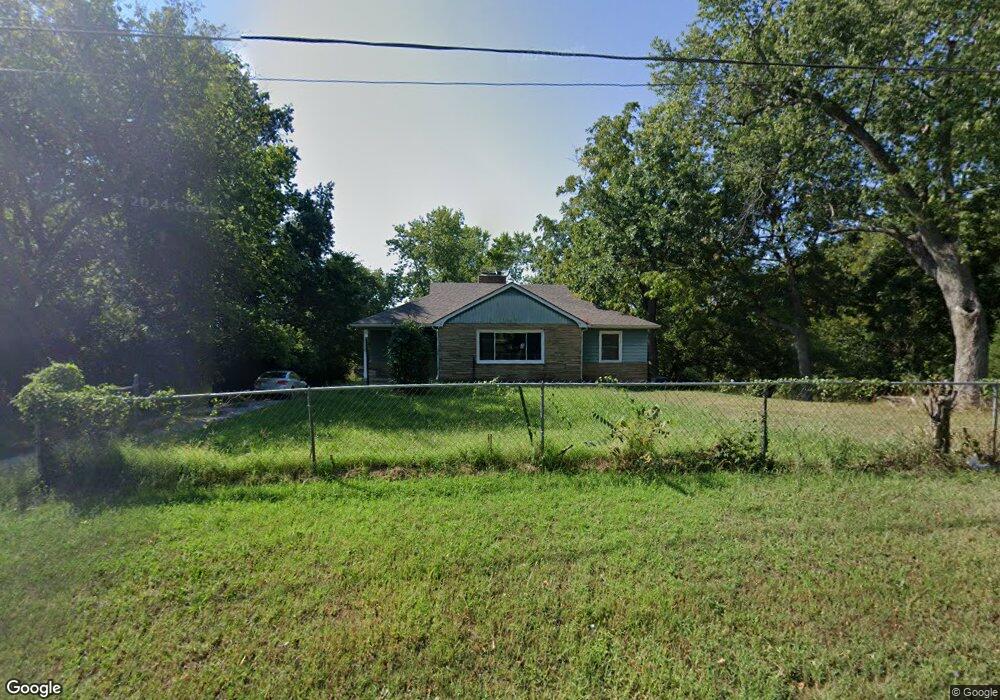
18005 Holke Rd Independence, MO 64057
Blackburn NeighborhoodEstimated Value: $252,000 - $274,000
3
Beds
2
Baths
1,370
Sq Ft
$192/Sq Ft
Est. Value
About This Home
This home is located at 18005 Holke Rd, Independence, MO 64057 and is currently estimated at $263,396, approximately $192 per square foot. 18005 Holke Rd is a home located in Jackson County with nearby schools including Blackburn Elementary School, Bridger Middle School, and Pioneer Ridge Middle School.
Ownership History
Date
Name
Owned For
Owner Type
Purchase Details
Closed on
Feb 1, 2007
Sold by
Tri Star Construction Co Inc
Bought by
Young William F and Welton Judith
Current Estimated Value
Home Financials for this Owner
Home Financials are based on the most recent Mortgage that was taken out on this home.
Original Mortgage
$80,000
Interest Rate
6.5%
Mortgage Type
Seller Take Back
Purchase Details
Closed on
Mar 8, 2002
Sold by
Jarnigan M D and Jarnigan Judy
Bought by
Tannon Edwardo
Home Financials for this Owner
Home Financials are based on the most recent Mortgage that was taken out on this home.
Original Mortgage
$121,018
Interest Rate
7.01%
Mortgage Type
FHA
Purchase Details
Closed on
Oct 30, 1997
Sold by
Smith Cindy L
Bought by
Jarnigan M D and Jarnigan Judy
Home Financials for this Owner
Home Financials are based on the most recent Mortgage that was taken out on this home.
Original Mortgage
$86,900
Interest Rate
10%
Mortgage Type
Purchase Money Mortgage
Create a Home Valuation Report for This Property
The Home Valuation Report is an in-depth analysis detailing your home's value as well as a comparison with similar homes in the area
Home Values in the Area
Average Home Value in this Area
Purchase History
| Date | Buyer | Sale Price | Title Company |
|---|---|---|---|
| Young William F | -- | Commonwealth Land Title Insu | |
| Tannon Edwardo | -- | Chicago Title Co | |
| Jarnigan M D | -- | First American Title Ins Co |
Source: Public Records
Mortgage History
| Date | Status | Borrower | Loan Amount |
|---|---|---|---|
| Closed | Young William F | $80,000 | |
| Previous Owner | Tannon Edwardo | $121,018 | |
| Previous Owner | Jarnigan M D | $86,900 |
Source: Public Records
Tax History
| Year | Tax Paid | Tax Assessment Tax Assessment Total Assessment is a certain percentage of the fair market value that is determined by local assessors to be the total taxable value of land and additions on the property. | Land | Improvement |
|---|---|---|---|---|
| 2025 | $3,155 | $30,905 | $11,622 | $19,283 |
| 2024 | $3,084 | $45,543 | $20,845 | $24,698 |
| 2023 | $3,084 | $45,543 | $12,677 | $32,866 |
| 2022 | $1,726 | $23,370 | $4,192 | $19,178 |
| 2021 | $1,726 | $23,370 | $4,192 | $19,178 |
| 2020 | $1,556 | $20,474 | $4,192 | $16,282 |
| 2019 | $1,531 | $20,474 | $4,192 | $16,282 |
| 2018 | $1,396 | $17,819 | $3,648 | $14,171 |
| 2017 | $1,396 | $17,819 | $3,648 | $14,171 |
| 2016 | $1,374 | $17,372 | $5,627 | $11,745 |
Source: Public Records
Map
Nearby Homes
- 2431 S Ponca Ave
- 5218 Indiana Ave
- 17813 E 26th St S
- 17504 E R D Mize Rd
- 18208 E 27th St S
- 2608 Baker Rd
- 2100 James Downey Rd
- 18608 E 26th Terrace S
- 2018 James Downey Rd
- 2804 S Whitney Ave
- 2805 Berry Ave
- 16805 Sunset Dr
- 2820 Berry Ln
- 2813 Trenchard Dr
- 1800 S M 291 Hwy
- 2417 S Ellison Way
- 2805 Castle Dr
- 1704 Highland Dr
- 1909 S Ellison Way
- 2527 Queen Ridge Dr
- 18101 Holke Rd
- 18105 Holke Rd
- 2316 Viking Dr
- 2312 Viking Dr
- 18010 E Holke Rd
- 18010 Holke Rd
- 17900 Holke Rd
- 2320 Viking Dr
- 2304 Viking Dr
- 18100 Holke Rd
- 17910 Holke Rd
- 2300 Viking Dr
- 2308 Viking Dr
- 2324 Viking Dr
- 2328 Viking Dr
- 2301 Viking Dr
- 18106 Holke Rd
- 17908 Holke Rd
- 2303 Viking Dr
- 17921 E State Route 78
Your Personal Tour Guide
Ask me questions while you tour the home.