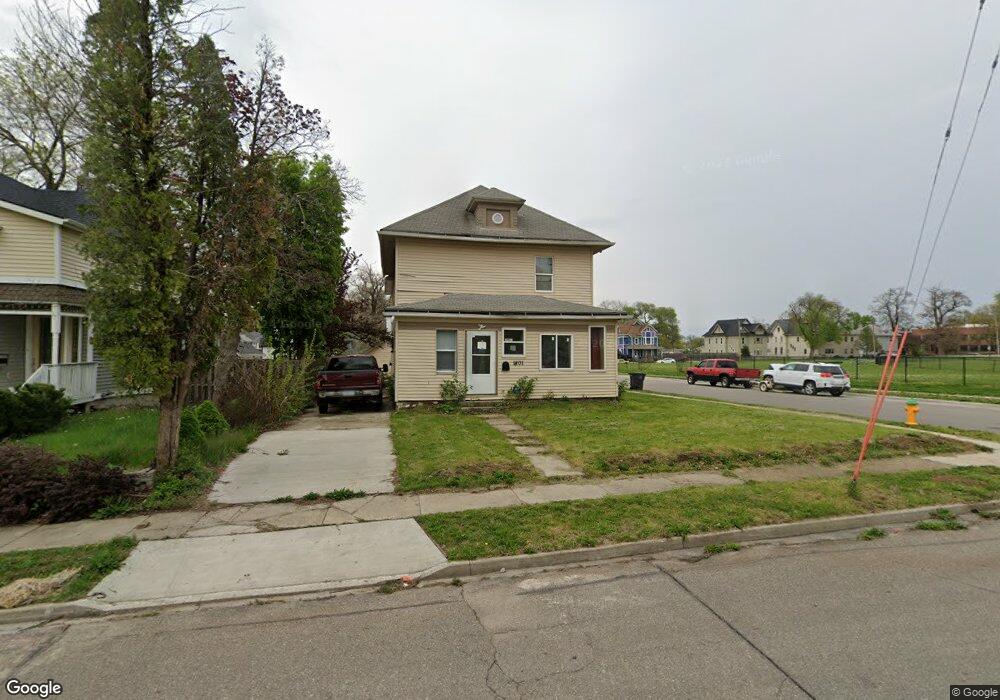
1801 11th St Des Moines, IA 50314
King Irving NeighborhoodEstimated Value: $146,679 - $223,000
3
Beds
1
Bath
2,230
Sq Ft
$79/Sq Ft
Est. Value
About This Home
This home is located at 1801 11th St, Des Moines, IA 50314 and is currently estimated at $176,420, approximately $79 per square foot. 1801 11th St is a home located in Polk County with nearby schools including Moulton Elementary School, Harding Middle School, and North High School.
Ownership History
Date
Name
Owned For
Owner Type
Purchase Details
Closed on
Sep 18, 2025
Sold by
Gonzalez Roxana and Gonzalez Salvador
Bought by
Gonzalez Salvador
Current Estimated Value
Home Financials for this Owner
Home Financials are based on the most recent Mortgage that was taken out on this home.
Original Mortgage
$100,000
Outstanding Balance
$99,941
Interest Rate
8.63%
Mortgage Type
New Conventional
Estimated Equity
$76,479
Purchase Details
Closed on
Jul 13, 2022
Sold by
Roxana Gonzalez
Bought by
Gonzalez Saluador
Purchase Details
Closed on
Jun 20, 2022
Sold by
Francisco Gonzalez
Bought by
Gonzalez Roxana
Purchase Details
Closed on
Dec 3, 2010
Sold by
Gonzalez Salvador
Bought by
Gonzalez Francisco
Purchase Details
Closed on
Sep 14, 2006
Sold by
Cole Dianne G
Bought by
Gonzalez Salvador
Purchase Details
Closed on
Jan 26, 1998
Sold by
Coburn Marguerite and Zuck Patricia A
Bought by
Cole Dianne G
Create a Home Valuation Report for This Property
The Home Valuation Report is an in-depth analysis detailing your home's value as well as a comparison with similar homes in the area
Home Values in the Area
Average Home Value in this Area
Purchase History
| Date | Buyer | Sale Price | Title Company |
|---|---|---|---|
| Gonzalez Salvador | -- | None Listed On Document | |
| Gonzalez Saluador | -- | None Listed On Document | |
| Gonzalez Roxana | -- | None Listed On Document | |
| Gonzalez Francisco | -- | None Available | |
| Gonzalez Salvador | -- | None Available | |
| Cole Dianne G | $24,500 | -- |
Source: Public Records
Mortgage History
| Date | Status | Borrower | Loan Amount |
|---|---|---|---|
| Open | Gonzalez Salvador | $100,000 |
Source: Public Records
Tax History Compared to Growth
Tax History
| Year | Tax Paid | Tax Assessment Tax Assessment Total Assessment is a certain percentage of the fair market value that is determined by local assessors to be the total taxable value of land and additions on the property. | Land | Improvement |
|---|---|---|---|---|
| 2025 | $1,832 | $108,700 | $13,700 | $95,000 |
| 2024 | $1,832 | $93,100 | $11,700 | $81,400 |
| 2023 | $1,318 | $93,100 | $11,700 | $81,400 |
| 2022 | $1,306 | $68,200 | $8,900 | $59,300 |
| 2021 | $1,206 | $68,200 | $8,900 | $59,300 |
| 2020 | $1,246 | $60,200 | $7,900 | $52,300 |
| 2019 | $1,146 | $60,200 | $7,900 | $52,300 |
| 2018 | $1,126 | $54,400 | $7,100 | $47,300 |
| 2017 | $1,158 | $54,400 | $7,100 | $47,300 |
| 2016 | $1,122 | $54,600 | $7,000 | $47,600 |
| 2015 | $1,122 | $54,600 | $7,000 | $47,600 |
| 2014 | $1,092 | $53,100 | $7,600 | $45,500 |
Source: Public Records
Map
Nearby Homes