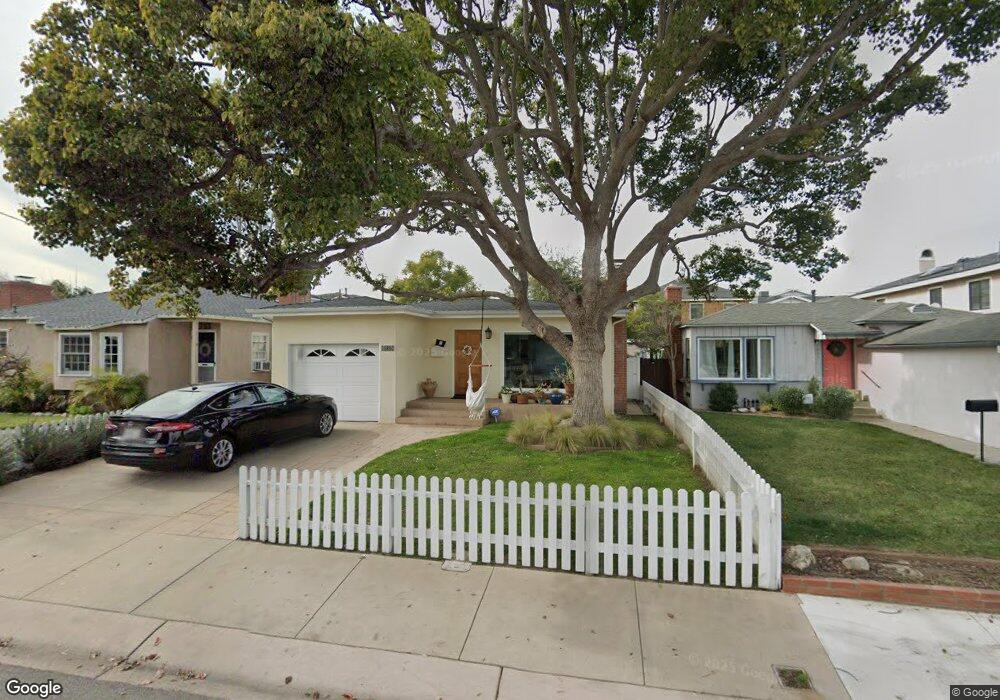
1801 Elm Ave Manhattan Beach, CA 90266
Estimated Value: $2,220,109 - $3,555,000
3
Beds
2
Baths
1,351
Sq Ft
$1,999/Sq Ft
Est. Value
About This Home
This home is located at 1801 Elm Ave, Manhattan Beach, CA 90266 and is currently estimated at $2,700,527, approximately $1,998 per square foot. 1801 Elm Ave is a home located in Los Angeles County with nearby schools including Pacific Elementary School, Manhattan Beach Middle School, and Mira Costa High School.
Ownership History
Date
Name
Owned For
Owner Type
Purchase Details
Closed on
Aug 28, 2023
Sold by
Jeffrey And Louisa Thomson Family Trust
Bought by
Jonathan Thomson Trust and Thomson
Current Estimated Value
Purchase Details
Closed on
Nov 22, 2021
Sold by
Thomson Jeffrey J and Thomson Louisa L
Bought by
Jeffrey And Louisa Thomson Family Trust and Fam Louisa
Purchase Details
Closed on
Feb 25, 2010
Sold by
Shepard Diane Y and Estate Of William Mattsson
Bought by
Thomson Jeffrey J and Thomson Louisa L
Create a Home Valuation Report for This Property
The Home Valuation Report is an in-depth analysis detailing your home's value as well as a comparison with similar homes in the area
Home Values in the Area
Average Home Value in this Area
Purchase History
| Date | Buyer | Sale Price | Title Company |
|---|---|---|---|
| Jonathan Thomson Trust | -- | None Listed On Document | |
| Jeffrey And Louisa Thomson Family Trust | -- | Law Offices Of Connie Yi Pc | |
| Thomson Jeffrey J | $805,000 | Fidelity National Title Co |
Source: Public Records
Tax History Compared to Growth
Tax History
| Year | Tax Paid | Tax Assessment Tax Assessment Total Assessment is a certain percentage of the fair market value that is determined by local assessors to be the total taxable value of land and additions on the property. | Land | Improvement |
|---|---|---|---|---|
| 2025 | $12,244 | $2,349,060 | $2,091,000 | $258,060 |
| 2024 | $12,244 | $1,040,769 | $814,984 | $225,785 |
| 2023 | $11,884 | $1,020,362 | $799,004 | $221,358 |
| 2022 | $11,684 | $1,000,356 | $783,338 | $217,018 |
| 2021 | $11,519 | $980,742 | $767,979 | $212,763 |
| 2019 | $11,216 | $951,654 | $745,201 | $206,453 |
| 2018 | $10,967 | $932,995 | $730,590 | $202,405 |
| 2016 | $10,094 | $896,768 | $702,221 | $194,547 |
| 2015 | $9,886 | $883,298 | $691,673 | $191,625 |
| 2014 | $9,754 | $865,997 | $678,125 | $187,872 |
Source: Public Records
Map
Nearby Homes