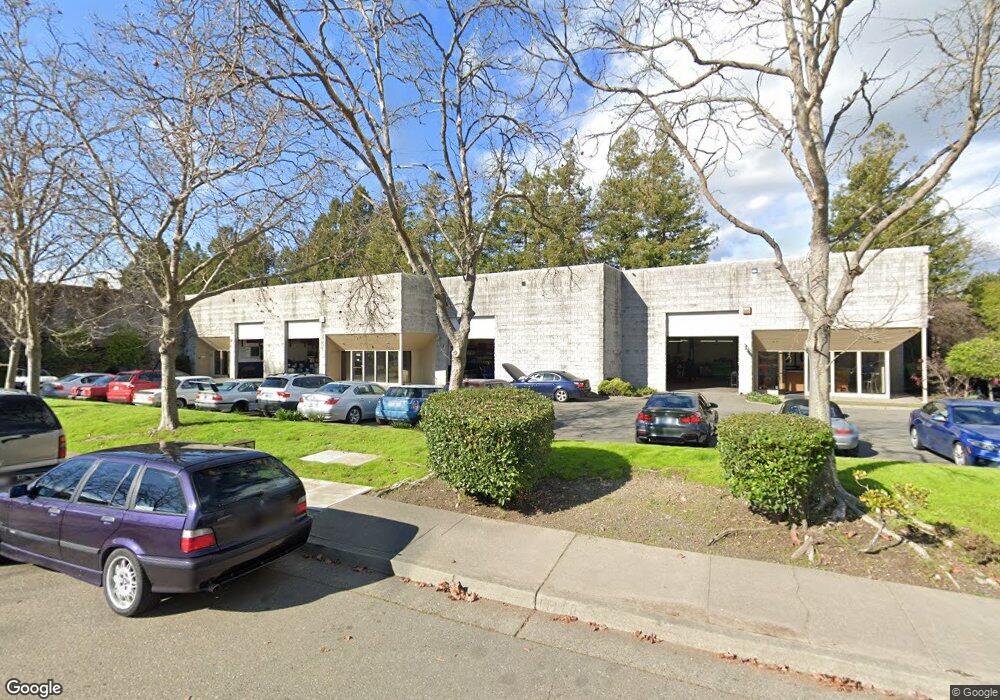
1801 Empire Industrial Ct Santa Rosa, CA 95403
Northwest Santa Rosa NeighborhoodEstimated Value: $2,672,404
--
Bed
--
Bath
9,924
Sq Ft
$269/Sq Ft
Est. Value
About This Home
This home is located at 1801 Empire Industrial Ct, Santa Rosa, CA 95403 and is currently estimated at $2,672,404, approximately $269 per square foot. 1801 Empire Industrial Ct is a home located in Sonoma County with nearby schools including Hilliard Comstock Middle School, Piner High School, and Morrice Schaefer Charter School.
Ownership History
Date
Name
Owned For
Owner Type
Purchase Details
Closed on
Jan 29, 2024
Sold by
Row Family Trust
Bought by
Grundstock Llc
Current Estimated Value
Home Financials for this Owner
Home Financials are based on the most recent Mortgage that was taken out on this home.
Original Mortgage
$2,303,921
Outstanding Balance
$2,263,205
Interest Rate
6.61%
Mortgage Type
New Conventional
Estimated Equity
$409,199
Purchase Details
Closed on
Jan 26, 2011
Sold by
Row Richard and Row Claudia
Bought by
Row Richard A and Row Claudia A
Purchase Details
Closed on
Aug 28, 2006
Sold by
Chaney Robert D and Chaney Betty L
Bought by
Row Richard and Row Claudia
Home Financials for this Owner
Home Financials are based on the most recent Mortgage that was taken out on this home.
Original Mortgage
$1,000,000
Interest Rate
6.76%
Mortgage Type
Seller Take Back
Purchase Details
Closed on
Feb 5, 2001
Sold by
Chaney Robert D and Chaney Betty L
Bought by
Chaney Robert D and Chaney Betty L
Purchase Details
Closed on
Jul 31, 2000
Sold by
Chaney Realty Inc
Bought by
Chaney Robert D
Create a Home Valuation Report for This Property
The Home Valuation Report is an in-depth analysis detailing your home's value as well as a comparison with similar homes in the area
Home Values in the Area
Average Home Value in this Area
Purchase History
| Date | Buyer | Sale Price | Title Company |
|---|---|---|---|
| Grundstock Llc | $2,500,000 | First American Title | |
| Row Richard A | -- | None Available | |
| Row Richard | $1,200,000 | Chicago Title Company | |
| Chaney Robert D | -- | -- | |
| Chaney Robert D | $50,000 | -- |
Source: Public Records
Mortgage History
| Date | Status | Borrower | Loan Amount |
|---|---|---|---|
| Open | Grundstock Llc | $2,303,921 | |
| Previous Owner | Row Richard | $1,000,000 |
Source: Public Records
Tax History Compared to Growth
Tax History
| Year | Tax Paid | Tax Assessment Tax Assessment Total Assessment is a certain percentage of the fair market value that is determined by local assessors to be the total taxable value of land and additions on the property. | Land | Improvement |
|---|---|---|---|---|
| 2025 | $18,235 | $2,550,000 | $765,000 | $1,785,000 |
| 2024 | $18,235 | $1,576,211 | $656,754 | $919,457 |
| 2023 | $18,235 | $1,545,306 | $643,877 | $901,429 |
| 2022 | $17,061 | $1,515,006 | $631,252 | $883,754 |
| 2021 | $17,818 | $1,485,301 | $618,875 | $866,426 |
| 2020 | $17,905 | $1,470,072 | $612,530 | $857,542 |
| 2019 | $17,731 | $1,441,248 | $600,520 | $840,728 |
| 2018 | $17,522 | $1,412,990 | $588,746 | $824,244 |
| 2017 | $14,809 | $1,200,000 | $500,000 | $700,000 |
| 2016 | $14,964 | $1,200,000 | $500,000 | $700,000 |
| 2015 | $14,647 | $1,200,000 | $500,000 | $700,000 |
| 2014 | $12,057 | $1,000,000 | $275,000 | $725,000 |
Source: Public Records
Map
Nearby Homes
- 1795 Walnut Creek Dr
- 1945 Piner Rd Unit 47
- 1945 Piner Rd Unit 16
- 1945 Piner Rd Unit 148
- 1945 Piner Rd Unit 105
- 1945 Piner Rd Unit 189
- 2170 Bock St
- 1906 Genoa Place
- 3523 Coffey Meadow Place
- 2137 Avilar Place
- 3593 Banyan St
- 3511 Barnes Rd
- 2976 Bay Village Ave
- 2234 Gold Leaf Ln
- 2110 Northfield Dr
- 2017 Shelbourne Way
- 90 Estrella Dr
- 85 Estrella Dr
- 2829 Apple Valley Ln
- 3702 Hillary Ct
- 1804 Sansone Dr
- 1800 Sansone Dr
- 1808 Sansone Dr
- 1805 Empire Industrial Ct
- 1800 Empire Industrial Ct Unit 1 & 2
- 1800 Empire Industrial Ct Unit 4
- 1816 Sansone Dr
- 1806 Empire Industrial Ct Unit 6
- 1809 Empire Industrial Ct
- 1801 Sansone Dr
- 1820 Sansone Dr
- 1824 Sansone Dr
- 1805 Sansone Dr
- 3345 Coffey Ln
- 1809 Sansone Dr
- 1814 Empire Industrial Ct Unit 16
- 3336 Coffey Ln
- 1813 Sansone Dr
- 1828 Sansone Dr
- 1819 Sansone Dr